jQuery+json百度图表插件实现饼状图
1、新建html文档。

2、书写hmtl代码。
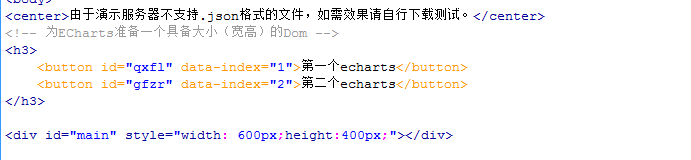
<center>由于演示服务器不支持.json格式的文件,如需效果请自行下载测试。</center>
<!-- 为ECharts准备一个具备大小(宽高)的Dom -->
<h3>
<button id="qxfl" data-index="1">第一个echarts</button>
<button id="gfzr" data-index="2">第二个echarts</button>
</h3>
<div id="main" style="width: 600px;height:400px;"></div>
3、初始化css代码。
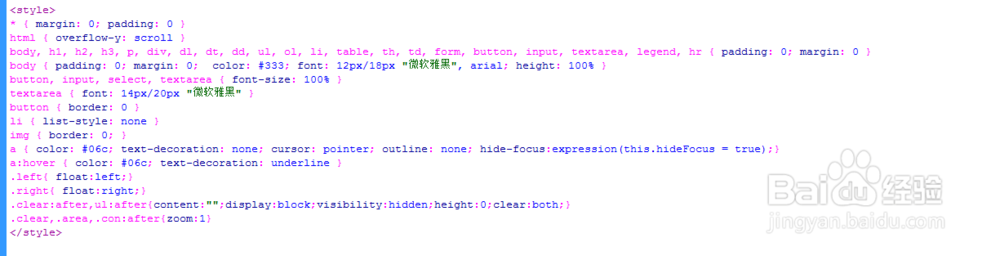
<style>
* { margin: 0; padding: 0 }
html { overflow-y: scroll }
body, h1, h2, h3, p, div, dl, dt, dd, ul, ol, li, table, th, td, form, button, input, textarea, legend, hr { padding: 0; margin: 0 }
body { padding: 0; margin: 0; color: #333; font: 12px/18px "微软雅黑", arial; height: 100% }
button, input, select, textarea { font-size: 100% }
textarea { font: 14px/20px "微软雅黑" }
button { border: 0 }
li { list-style: none }
img { border: 0; }
a { color: #06c; text-decoration: none; cursor: pointer; outline: none; hide-focus:expression(this.hideFocus = true);}
a:hover { color: #06c; text-decoration: underline }
.left{ float:left;}
.right{ float:right;}
.clear:after,ul:after{content:"";display:block;visibility:hidden;height:0;clear:both;}
.clear,.area,.con:after{zoom:1}
</style>
4、书写并添加js代码。
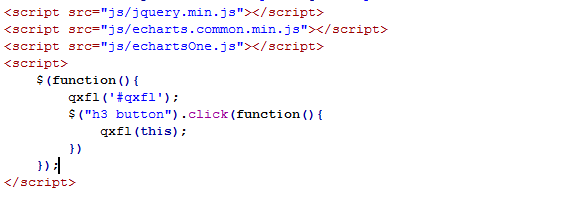
<script src="js/jquery.min.js"></script>
<script src="js/echarts.common.min.js"></script>
<script src="js/echartsOne.js"></script>
<script>
$(function(){
qxfl('#qxfl');
$("h3 button").click(function(){
qxfl(this);
})
});
</script>
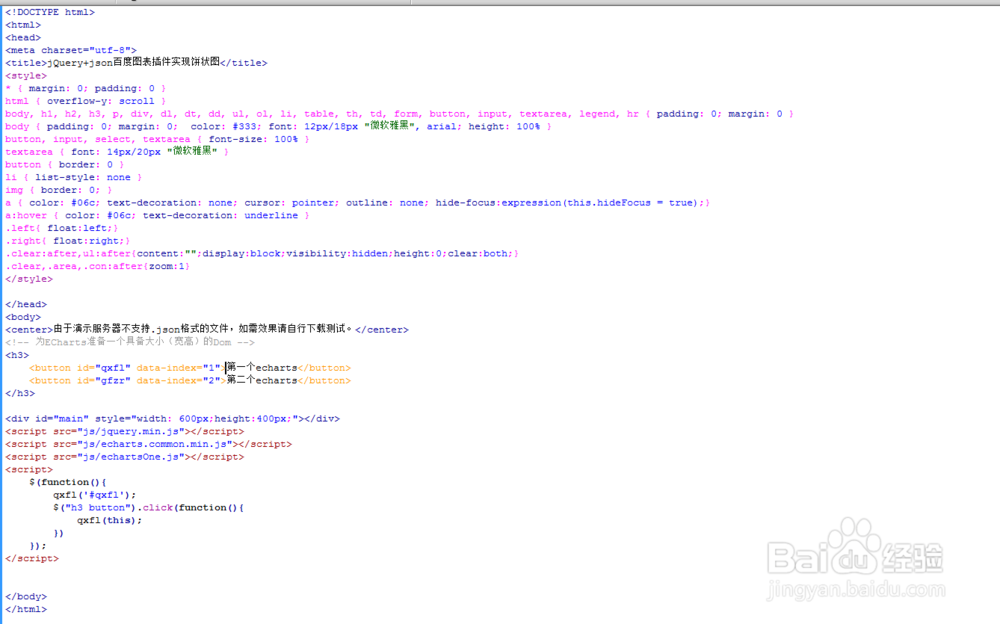
5、代码整体结构。
6、查看效果。