数字波形产生:近似正弦波
1、在双精度浮点中创建表
命令行键入:
N = 256;
angle = 2*pi * (0:(N-1))/N;
s = sin( angle )';
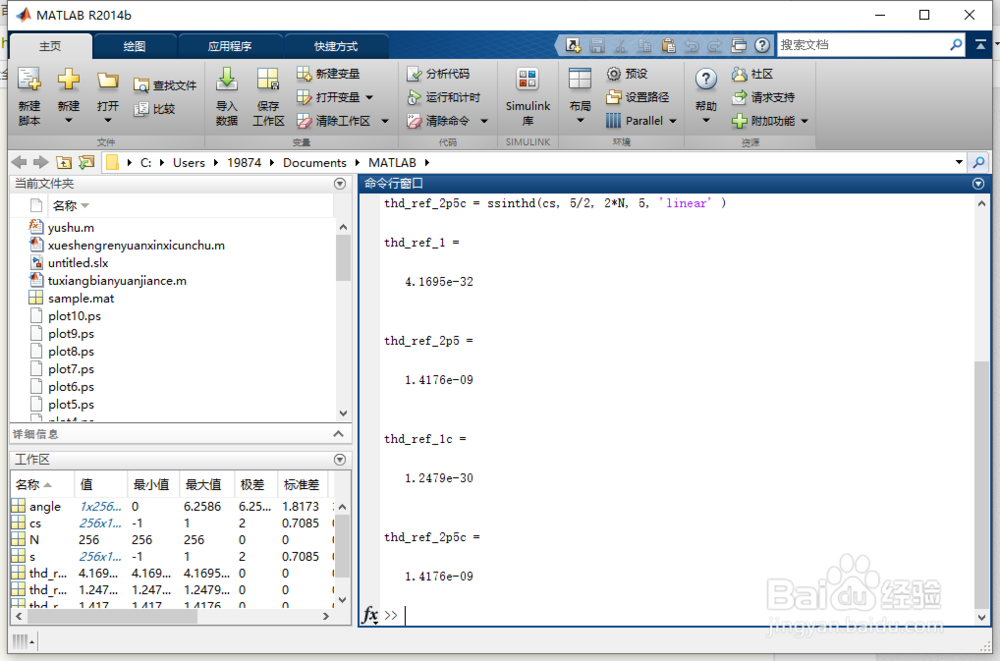
thd_ref_1 = ssinthd( s, 1, N, 1, 'direct' )
thd_ref_2p5 = ssinthd( s, 5/2, 2*N, 5, 'linear' )
cs = cordicsin( angle, 50 )';
thd_ref_1c = ssinthd(cs, 1, N, 1, 'direct' )
thd_ref_2p5c = ssinthd(cs, 5/2, 2*N, 5, 'linear' )
2、如图1所示。
3、将正弦波近似应用于模型中
命令行键入:
open_system('sldemo_tonegen');
set_param('sldemo_tonegen', 'StopFcn','');
sim('sldemo_tonegen');
currentFig = figure('Color',[1,1,1]);
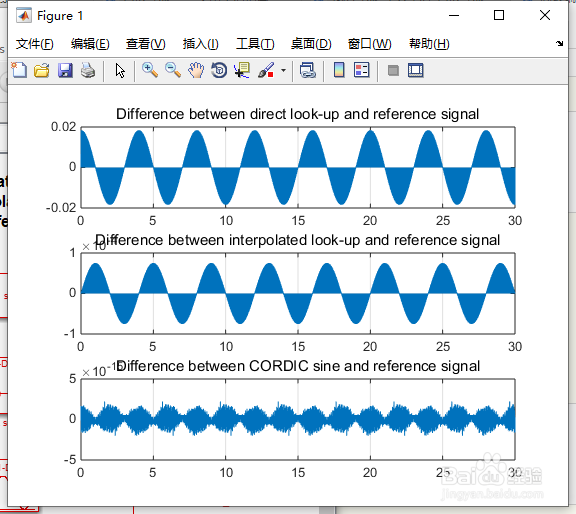
subplot(3,1,1), plot(tonegenOut.time, tonegenOut.signals(1).values); grid
title('Difference between direct look-up and reference signal');
subplot(3,1,2), plot(tonegenOut.time, tonegenOut.signals(2).values); grid
title('Difference between interpolated look-up and reference signal');
subplot(3,1,3), plot(tonegenOut.time, tonegenOut.signals(3).values); grid
title('Difference between CORDIC sine and reference signal');
4、如图2所示。

5、运行这个模型。
如图3所示。
6、仔细观察波形精度
命令行键入:
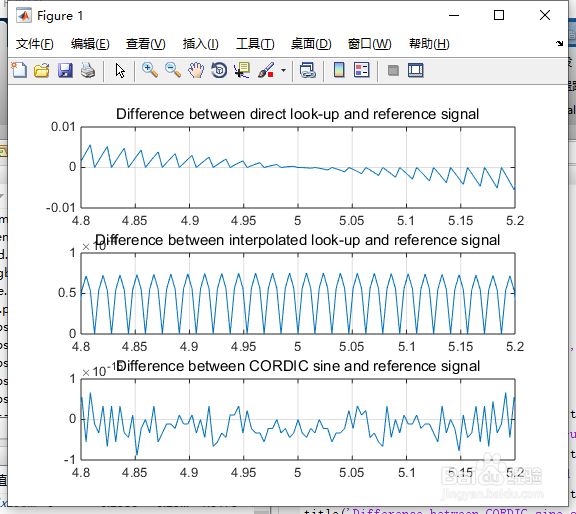
ax = get(currentFig,'Children');
set(ax(3),'xlim',[4.8, 5.2])
set(ax(2),'xlim',[4.8, 5.2])
set(ax(1),'xlim',[4.8, 5.2])
7、如图4所示。
8、同一表,固定点实现
命令行键入:
bits = 24;
is = num2fixpt( s, sfrac(bits), [], 'Nearest', 'on');
thd_direct1 = ssinthd(is, 1, N, 1, 'direct')
thd_direct2 = ssinthd(is, 2, N, 2, 'direct')
thd_direct3 = ssinthd(is, 3, N, 3, 'direct')
thd_linterp_2p5 = ssinthd(is, 5/2, 2*N, 5, 'fixptlinear')
9、如图5所示。

10、比较不同表格和方法的结果
命令行键入:
thd_double_direct = ssinthd( s, 33/4, 4*N, 33, 'direct')
thd_sfrac24_direct = ssinthd(is, 33/4, 4*N, 33, 'direct')
thd_double_linear = ssinthd( s, 33/4, 4*N, 33, 'linear')
thd_sfrac24_linear = ssinthd(is, 33/4, 4*N, 33, 'fixptlinear')
11、如图6所示。

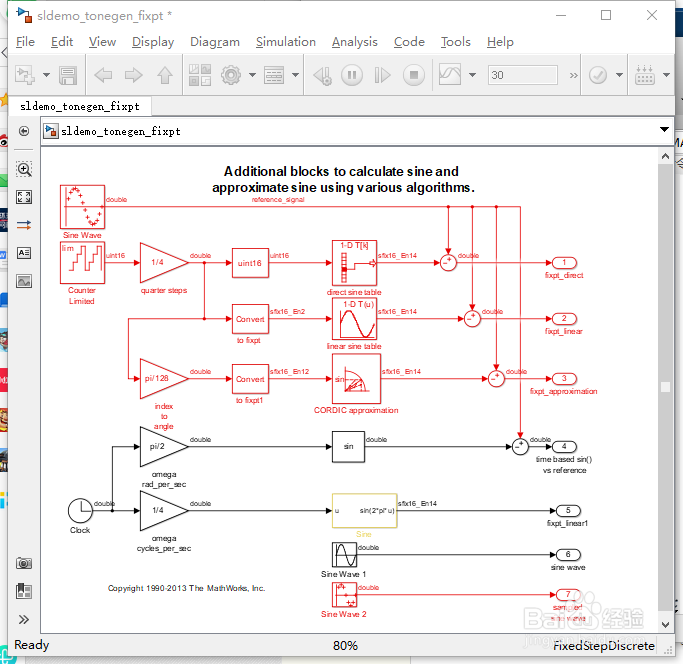
12、使用预先配置的正弦波块
命令行键入:
open_system('sldemo_tonegen_fixpt');
set_param('sldemo_tonegen_fixpt', 'StopFcn','');
sim('sldemo_tonegen_fixpt');
figure('Color',[1,1,1]);
subplot(3,1,1), plot(tonegenOut.time, tonegenOut.signals(1).values); grid
title('Difference between direct look-up and reference signal');
subplot(3,1,2), plot(tonegenOut.time, tonegenOut.signals(2).values); grid
title('Difference between interpolated look-up and reference signal');
subplot(3,1,3), plot(tonegenOut.time, tonegenOut.signals(3).values); grid
title('Difference between CORDIC sine and reference signal');
13、如图7、8所示。

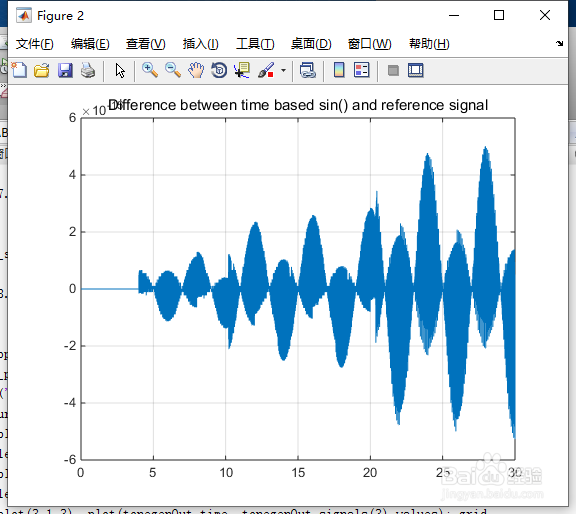
14、带时钟输入的正弦函数的使用
命令行键入:
subplot(1,1,1), plot(tonegenOut.time, tonegenOut.signals(4).values); grid
title('Difference between time based sin() and reference signal');
15、如图9所示。
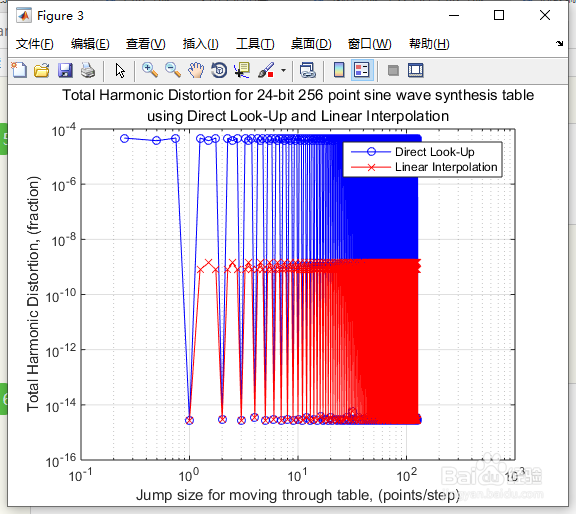
16、直接查找和线性插值的行为综述
命令行键入:
figure('Color',[1,1,1])
tic, sldemo_sweeptable_thd(24, 256), toc
17、如图10所示。