Mathematica基础——处理简单的图论问题
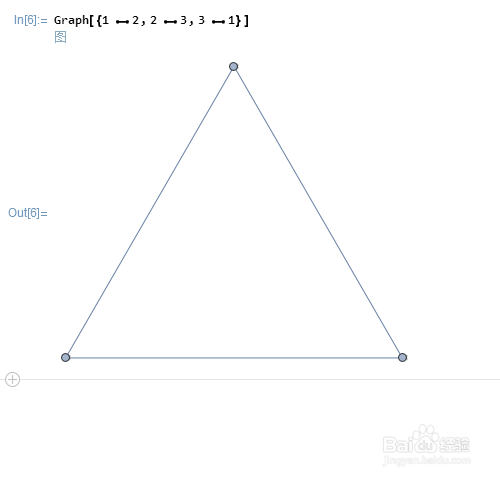
1、绘制一个没有明确方向的图:
Graph[{1 <-> 2, 2 <-> 3, 3 <-> 1}]
图里的顶点分别是1、2、3,但是省略了标签!
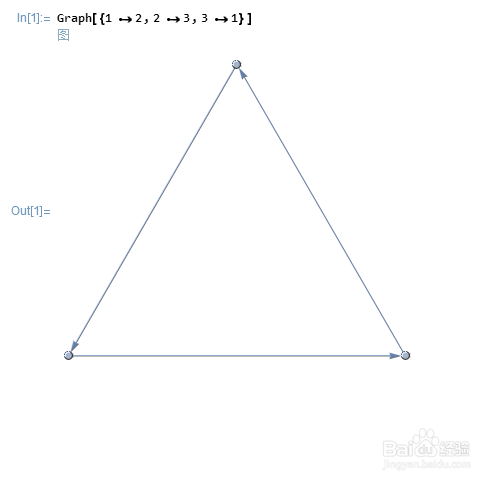
2、再来绘制一个有向图:
Graph[{1 -> 2, 2 -> 3, 3 -> 1}]
3、改变边和顶点的样式:
Graph[{1 <-> 2, 2 <-> 3, 3 <-> 1,1 <-> 5}, VertexStyle -> Orange, EdgeStyle -> Green]
Vertex是顶点的意思,Edge是边的意思!

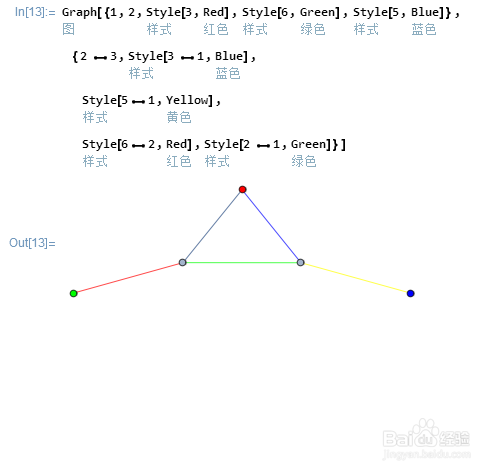
4、还可以把样式封装起来:
Graph[{1, 2, Style[3, Red],Style[6,Green],Style[5,Blue]}, { 2 <-> 3, Style[3 <-> 1, Blue], Style[5<-> 1, Yellow], Style[6<->2, Red], Style[2 <-> 1, Green]}]
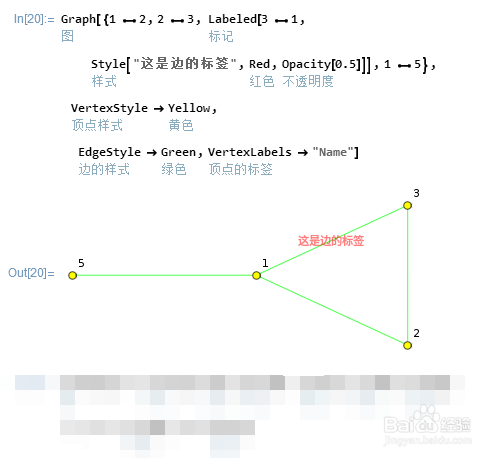
5、给图的顶点和边添加标签,还可以对标签设置不同的样式!
Graph[{1 <-> 2, 2 <-> 3, Labeled[3 <-> 1, Style[ "这是边的标签",Red,Opacity[0.5]]],1 <-> 5}, VertexStyle -> Yellow, EdgeStyle -> Green,VertexLabels -> "Name"]
Opacity是透明度的意思!
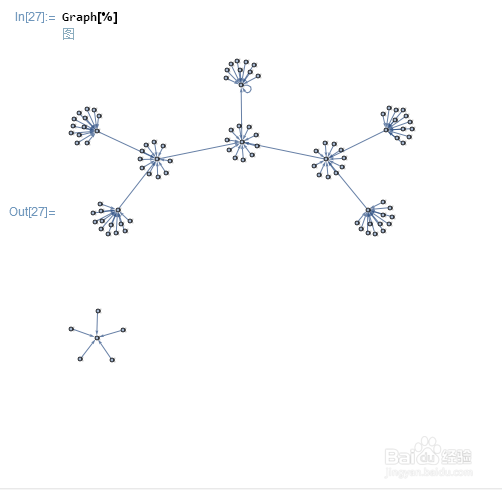
1、求前100个数字的平方,除以17的余数,并把这个映射画成图!
先做列表:
Table[i -> Mod[i^2, 17], {i, 100}]
再构造图:
Graph[%]

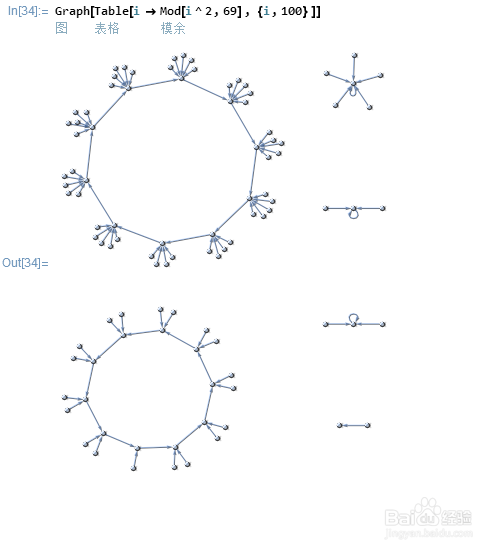
2、这是换了一个除数的结果:
Graph[Table[i -> Mod[i^2, 69], {i, 100}]]
3、我们可以给出各顶点的标签,这样看着容易一些:
Graph[Table[i -> Mod[i^2, 69], {i, 100}],VertexLabels -> "Name"]

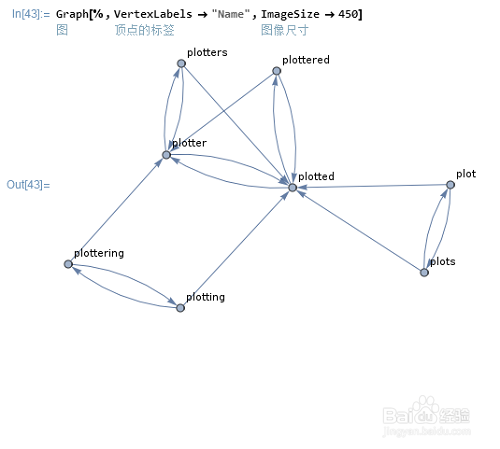
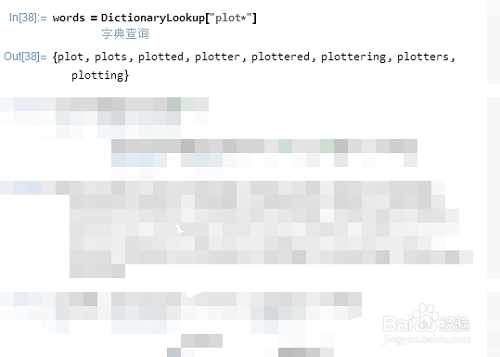
1、列举以plot开头的所有英文单词:
words = DictionaryLookup["plot*"]
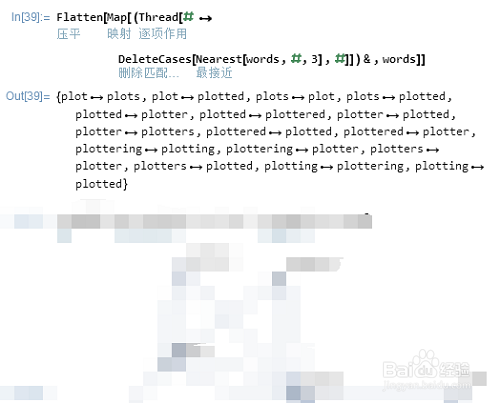
2、把相互之间比较接近的单词,用箭头连起来:
Flatten[Map[(Thread[# \[DirectedEdge] DeleteCases[Nearest[words, #, 3], #]]) &, words]]
3、作图,并显示标签:
Graph[%, VertexLabels -> "Name", ImageSize ->365]