MATLAB plotyy双纵坐标图的纵坐标设置
1、我们首先打开MATLAB2012b,运行一段小程序。
x=[0 2 4 6 8 10];
y1=[0.65 0.645 0.64 0.586 0.626 0.615];
y2=[82 84 88 95 73 67];
hold on;
[AX,H1,H2] =plotyy(x,y1,x,y2,@plot);% 获取坐标轴、图像句柄
set(get(AX(1),'ylabel'),'string', '峰值透过率','fontsize',16);
set(get(AX(2),'ylabel'),'string', '半高宽/nm','fontsize',16);
xlabel('倾斜角度/°','fontsize',16);
set(H1,'Linestyle','--');
set(H2,'Linestyle',':');
set(gcf,'color','white')
set(gca,'linewidth',1.5) %设置边框宽度

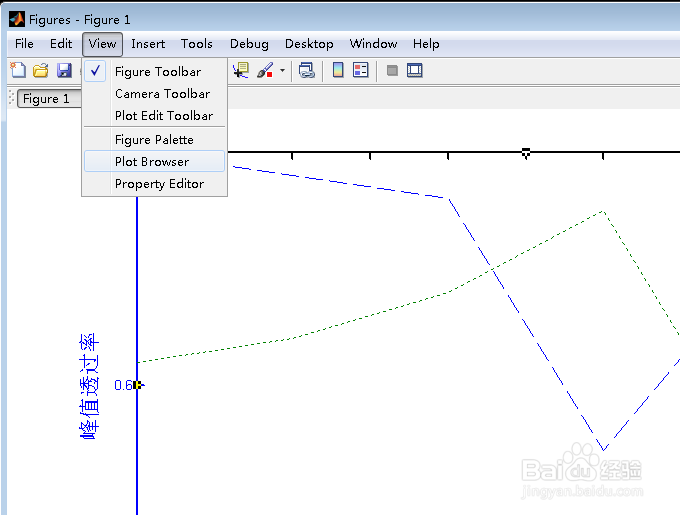
2、在MATLAB figures窗口中,点击工具栏上view,选择plot Browser。
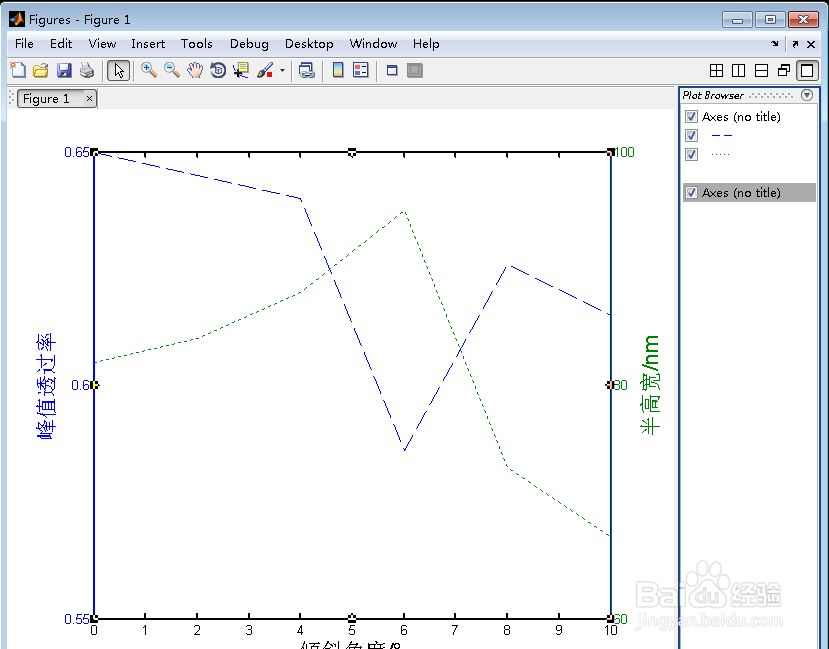
3、在figures窗口的右边看到plot Browser框
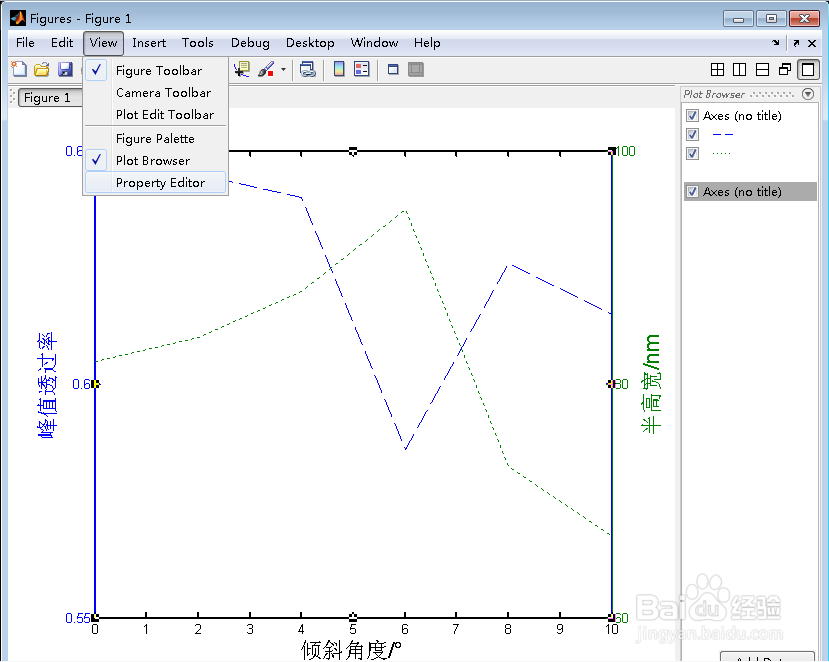
4、在MATLAB figures窗口中,点击工具栏上view,选择property Editor。
5、在figures窗口的右边看到property Editor框
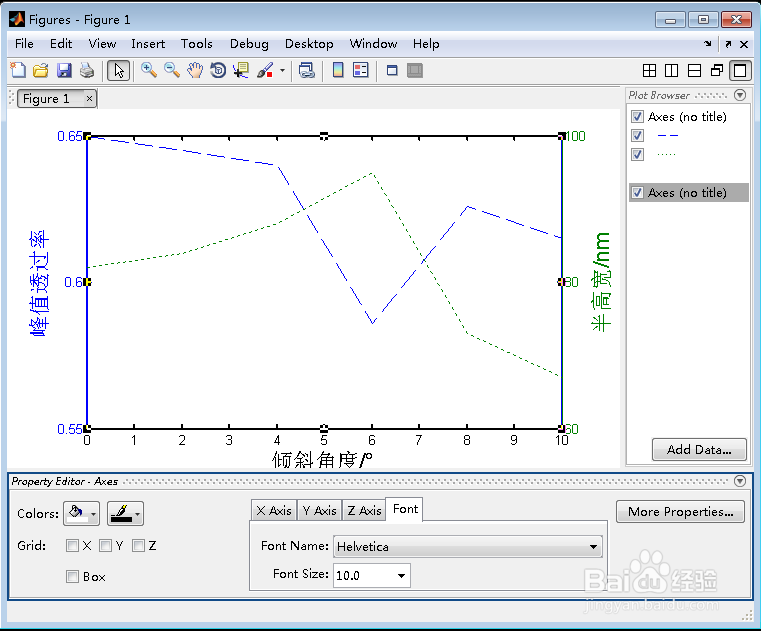
6、在plot Browser中有四个项目。从上往下,第一个Axes代表左侧纵坐标,第四个代表右侧纵坐标。中间两个项目分别代表图中的两条线。点击选中plot Browser中第一个项目,在property Editor框的 font name(字体)、font size(字号)栏中选择。效果如图中所示。此时X轴出现了两种字号不同的字,不要紧,下一步可以消除掉。

7、点击选中plot Browser中第四个项目,在property Editor框的 font name(字体)、font size(字号)栏中选择。效果如图中所示。此时X轴上的字恢复正常。
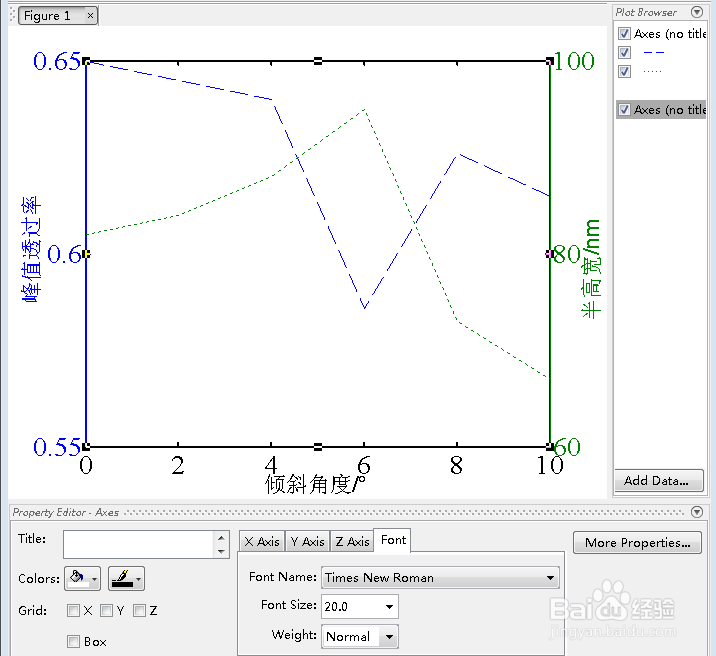
8、此外,点击选中plot Browser中第二项,和第三项。在property Editor框的line栏对曲线的线型、线宽进行设置,在marker中对数据点的形状、大小进行设置。还可以在property Editor框中进行网格等其他设置。最终效果如图中所示。
