python 如何使用matplotlib画出双曲螺线?
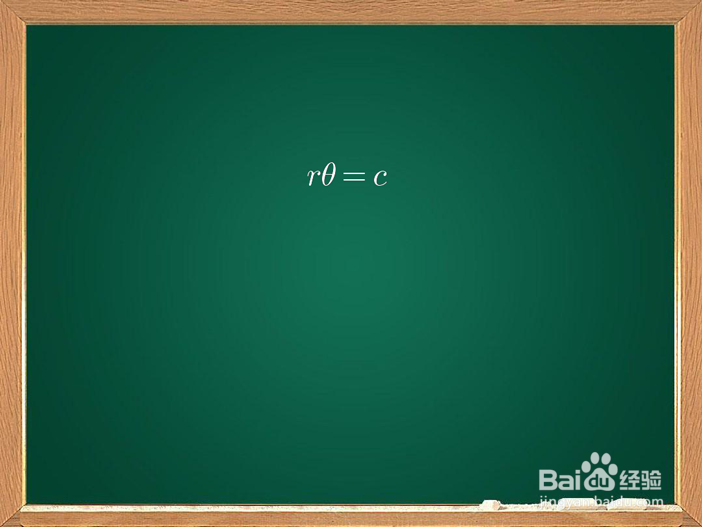
1、双曲螺线的极坐标的公式为(其中c 为常数):
2、首先引入需要的模块:

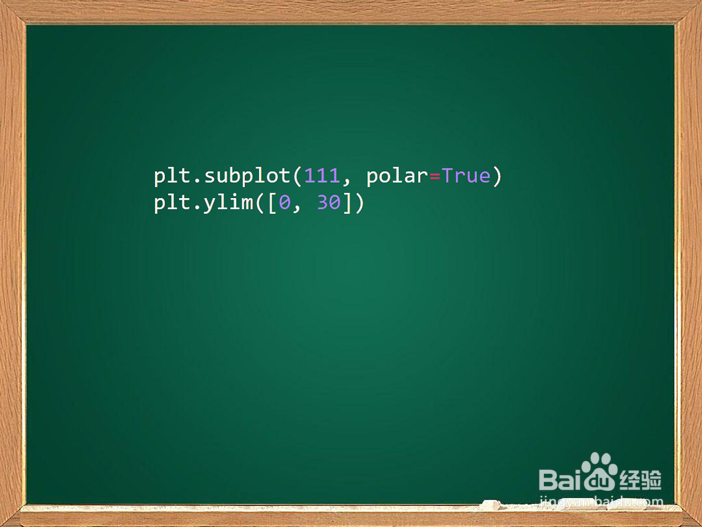
3、此时我们需要创建极坐标:
4、再次填充曲线坐标的点:

5、最后得到双曲螺线的极坐标的显示图像:

6、下面为实现的代码:
import matplotlib.pyplot as plt
import numpy as np
plt.subplot(111, polar=True)
plt.ylim([0, 30])
N = 4
c = 30
theta = np.arange(0.01, N * np.pi, np.pi / 100)
plt.plot(theta, c/theta, '--')
plt.show()
1、双曲螺线的直角坐标的公式为(其中c 为常数):

2、首先引入需要的模块:

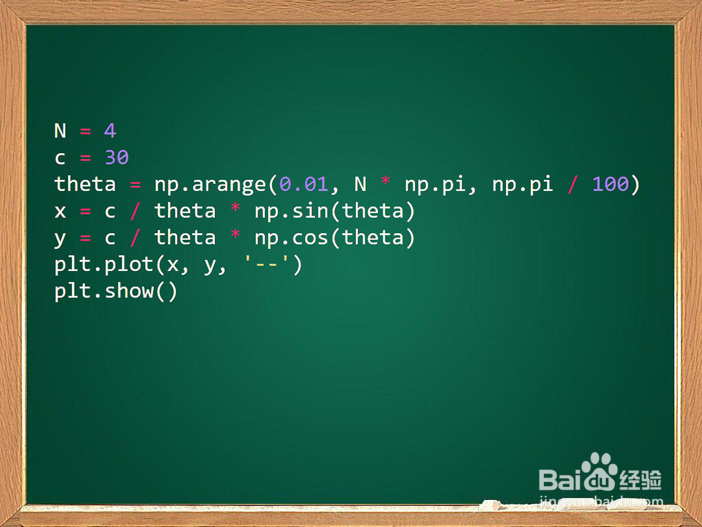
3、由于matplotlib默认的坐标系为笛卡尔直角坐标系,此时我们无需手动创建直角坐标,此时进行填充曲线坐标的点:
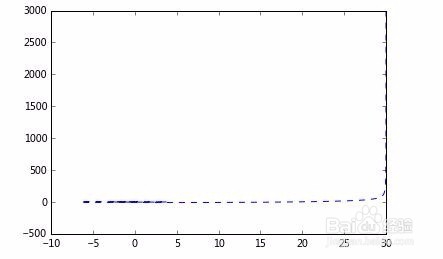
4、最后得到双曲螺线的笛卡尔坐标的显示图像,从该图像中我们可以看出双曲螺线的渐近线为:c = 30:
5、下面为实现的代码:
import matplotlib.pyplot as plt
import numpy as np
N = 4
c = 30
theta = np.arange(0.01, N * np.pi, np.pi / 100)
x = c / theta * np.sin(theta)
y = c / theta * np.cos(theta)
plt.plot(x, y, '--')
plt.show()
声明:本网站引用、摘录或转载内容仅供网站访问者交流或参考,不代表本站立场,如存在版权或非法内容,请联系站长删除,联系邮箱:site.kefu@qq.com。
阅读量:56
阅读量:191
阅读量:32
阅读量:150
阅读量:191