三维图形的绘制
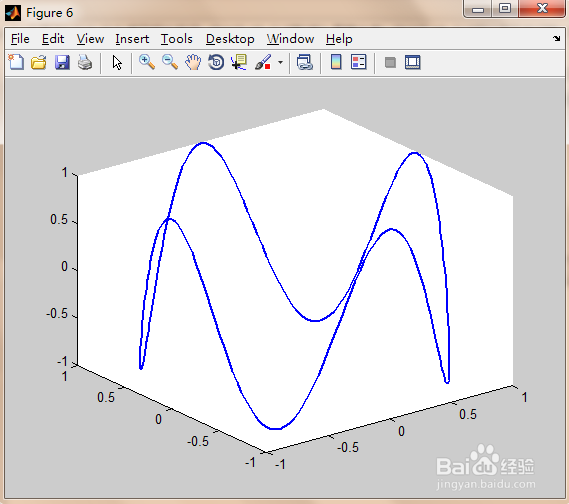
1、 曲线图绘制:plot3指令使用示例
在命令窗口中输入以下代码:
>> theta = 0: 0.01*pi: 2*pi;
>> x = sin(theta);
>> y = cos(theta);
>> z = cos(4*theta);
>> figure
运行结果如下:
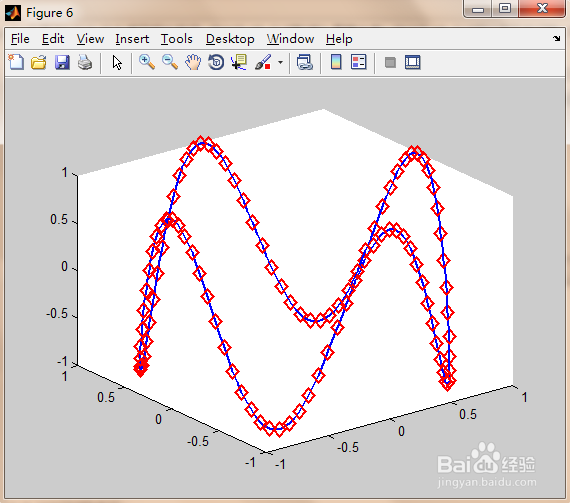
2、>> theta = 0: 0.02*pi: 2*pi;
>> x = sin(theta);
>> y = cos(theta);
>> z = cos(4*theta);
>> plot3(x,y,z,'rd','MarkerSize',10,'LineWidth',2)
3、 网格图绘制
绘制三维网格图的过程如下:
(1)确定自变量x和y的取值范围间隔如下:
x = x1:dx:x2,y = y1:dy:y2
(2)构成xoy平面上的自变量采样“格点”矩阵:
法1:利用“格点”矩阵原理生成矩阵。
x = x1:dx:x2;y = y1:dy:y2;
X = ones(size(y))*x;
Y = y*ones(size(x));
法2:利用meshgrid指令生成“格点”矩阵。
x = x1:dx:x2;y = y1:dy:y2;
[X,Y] = meshgrid(x,y);
(3)计算在自变量采样“格点”上的函数值:Z=f(X,Y)。
代码如下:
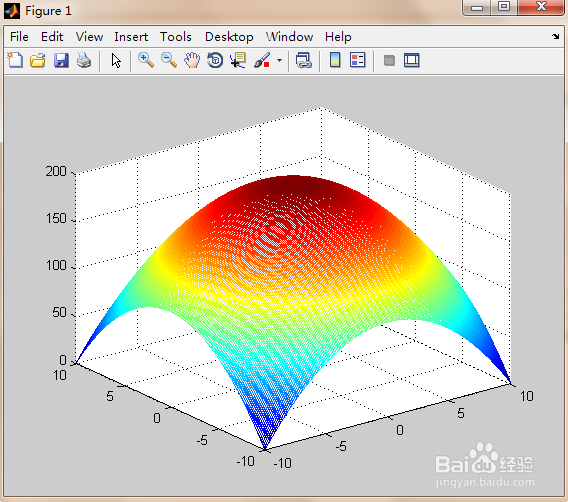
>> X = -10:0.1:10;Y = -10:0.1:10;
>> [X,Y] = meshgrid(X,Y);
>> Z = -X.^2 - Y.^2 + 200;
>> mesh(X,Y,Z)
4、曲面图的绘制:surf指令与mesh指令对比
代码如下:
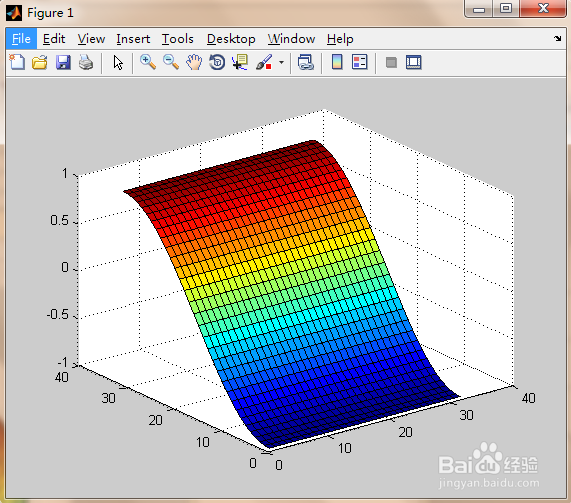
k = 5;
n = 2^k-1;
[x,y,z] = sphere(n);
c = hadamard(2^k);
figure(1)
surf(z);
figure(2)
surf(x,y,z);
axis equal
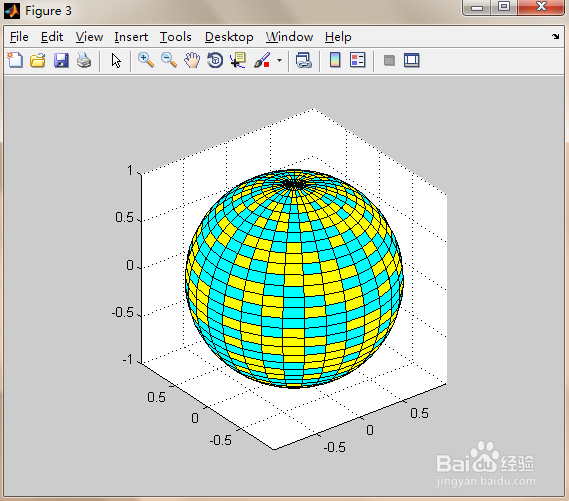
figure(3)
surf(x,y,z,c);
colormap([1 1 0; 0 1 1])
axis equal
运行结果如下:

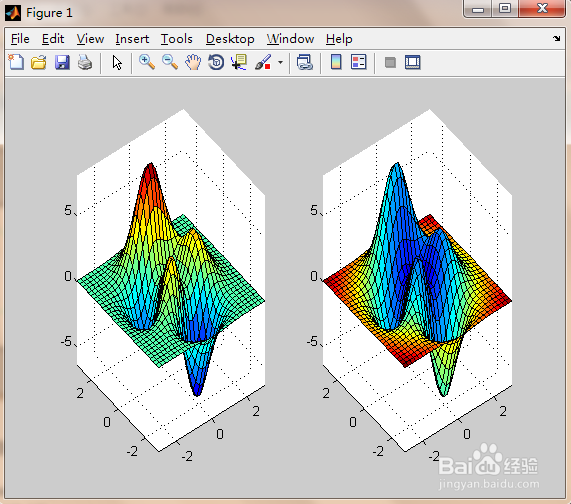
5、光照模型:带光照的曲面图
代码如下:
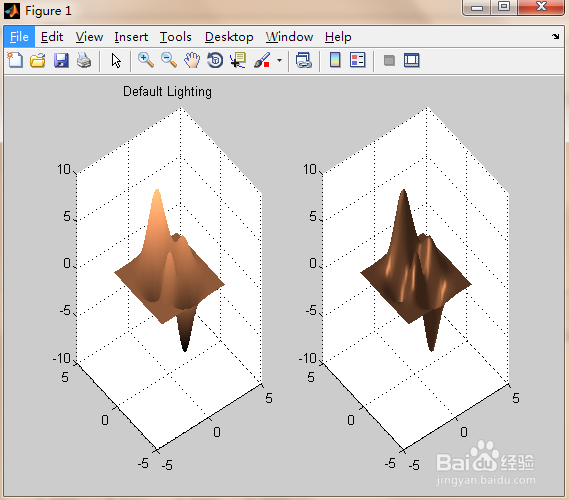
>> [X,Y,Z] = peaks(30);
>> subplot(1,2,1);
>> surf(X,Y,Z),colormap(copper),title('Default Lighting'),shading interp
>> subplot(1,2,2);surfl(X,Y,Z,[-90 30],[0.55 0.6 2 10]),shading interp
运行结果如下图所示:
6、绘制等值线图:contour指令使用实例
代码如下:
>> [X,Y,Z] = peaks(30);
>> figure;
>> subplot(2,2,1);contour(X,Y,Z);axis square
>> subplot(2,2,2);contour(X,Y,Z,10);axis square
>> subplot(2,2,3);contour(X,Y,Z,-10:1:10);axis square
>> subplot(2,2,4);contour(X,Y,Z,'');axis square
运行结果如下:

7、用颜色描述第四维:
代码如下:
>> [X,Y,Z] = peaks(30);
>> R = sqrt(X.^2+Y.^2);
>> subplot(1,2,1);surf(X,Y,Z,Z);
>> axis tight
>> subplot(1,2,2);surf(X,Y,Z,R);
>> axis tight
运行结果如下: