opencv+python用直方图进行相似度判断、对比
1、直方图作为一种常用的方法,经常用在数据分析和图片处理过程,
采用直方图对比图片相似性,简单明了直观。
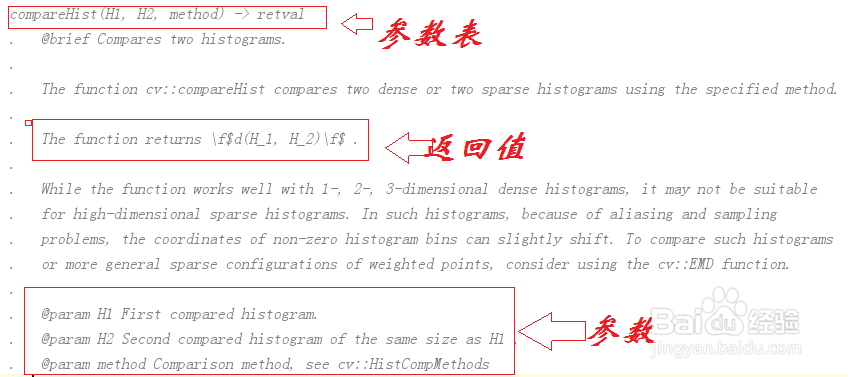
根据官网函数说明:
# compareHist(H1, H2, method) -> retval# @param H1 First compared histogram.# @param H2 Second compared histogram of the same size as H1.# @param method Comparison method, see cv::HistCompMethods
HistCompMethods:
HISTCMP_BHATTACHARYYA
Correlation ( HISTCMP_CORREL)相关性,
Chi-Square ( HISTCMP_CHISQR) 卡方,
Intersection ( HISTCMP_INTERSECT )交集法,
Bhattacharyya distance ( HISTCMP_BHATTACHARYYA)常态分布比对的Bhattacharyya距离法。

2、import cv2 as cvimport numpy as npimport copyfrom matplotlib import pyplot as pltimage = cv.imread('c:\\meiping1.png')cv.imshow("image", image)pic = cv.imread('c:\\meiping4.png')cv.imshow("pic", pic)
两幅图有一定相似,但大有不同。
另外注意 必须大小一样,否则不行!


3、# 计算图1的直方图 然后分别归一化
histGrayImage = cv.calcHist([image], [1], None, [256], [0, 256])
cv.normalize(histGrayImage, histGrayImage,0,255*0.9,cv.NORM_MINMAX)
# 计算图2的直方图然后分别归一化
histGrayPic = cv.calcHist([pic], [1], None, [256], [0, 256])
cv.normalize(histGrayPic, histGrayPic,0,255*0.9,cv.NORM_MINMAX)

4、显示直方图
plt.subplot(2, 1, 1)
plt.plot(histGrayImage)
plt.subplot(2, 1, 2)
plt.plot(histGrayPic)
plt.show()

5、retval1 = cv.compareHist(histGrayImage, histGrayPic, cv.HISTCMP_BHATTACHARYYA)
print("retval1: {}".format(retval1))
retval2 = cv.compareHist(histGrayImage, histGrayPic, cv.HISTCMP_CORREL)
print("retval2: {}".format(retval2))
retval3 = cv.compareHist(histGrayImage, histGrayPic, cv.HISTCMP_CHISQR)
print("retval3: {}".format(retval3))
cv.waitKey(0)

6、从计算可以看出 相似度还是有一些的!
比想象的相似度要高.