matlab如何使用plots建立2D和3D图形
1、首先打开一个matlab,
然后在编辑区直接输入命令即可,
如图生成一个线性的2D图形。
输入
x = 0:pi/100:2*pi;
y = sin(x);
plot(x,y)

2、还可以在图形上添加标题,
输入以下指令即可,
xlabel('x')
ylabel('sin(x)')
title('Plot of the Sine Function'),
这样直观多了。

3、如果不想要实线的图,
可以换成虚线的图,
输入
plot(x,y,'r--')
即可。

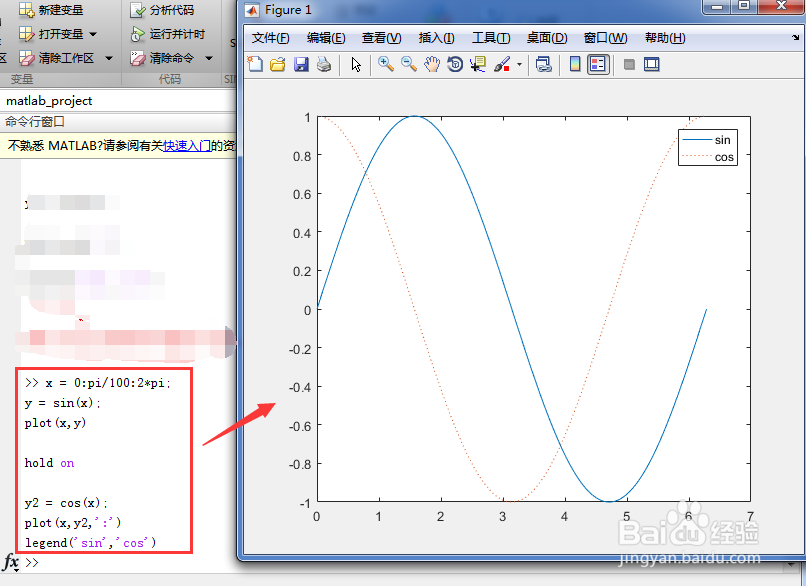
4、有时如果需要两个曲线在一个图形怎么办呢?
用hold on 参数即可。
例如输入
x = 0:pi/100:2*pi;y = sin(x);plot(x,y)hold ony2 = cos(x);plot(x,y2,':')legend('sin','cos')
5、下面就来介绍一下如何生成3D的数据X,Y,Z。
主要就是可以通过建立数据,使用surf这个接口,
例如:
[X,Y] = meshgrid(-2:.2:2);
Z = X .* exp(-X.^2 - Y.^2);
surf(X,Y,Z)

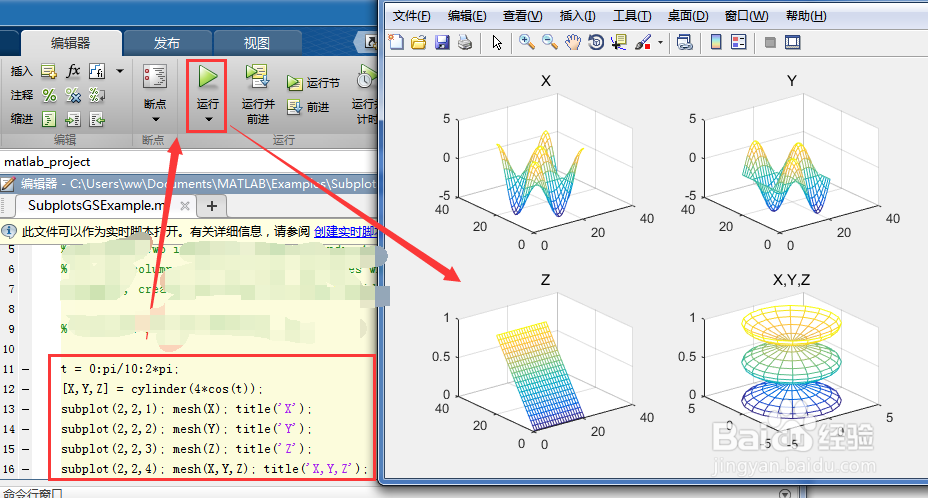
6、如果需要多个图形,
还可以使用subplot,建立多个图形在一起的。
例如:
t = 0:pi/10:2*pi;
[X,Y,Z] = cylinder(4*cos(t));
subplot(2,2,1); mesh(X); title('X');
subplot(2,2,2); mesh(Y); title('Y');
subplot(2,2,3); mesh(Z); title('Z');
subplot(2,2,4); mesh(X,Y,Z); title('X,Y,Z');
声明:本网站引用、摘录或转载内容仅供网站访问者交流或参考,不代表本站立场,如存在版权或非法内容,请联系站长删除,联系邮箱:site.kefu@qq.com。
阅读量:46
阅读量:88
阅读量:89
阅读量:193
阅读量:82