matlab如何在图中作字母标记-text函数使用攻略
1、text函数是用于创建文本图形对象的低级函数。 使用text将字符串放在指定的位置。
text(x,y,'string')将引号中的字符串添加到由点(x,y)指定的位置,x,和y必须是类double的数字。
text(x,y,z,'string')在三维坐标中添加字符串。 x,y和z必须是double类的数字。
2、text(x,y,z,'string')
is equivalent to:
text('Position',[x,y,z],'String','string')
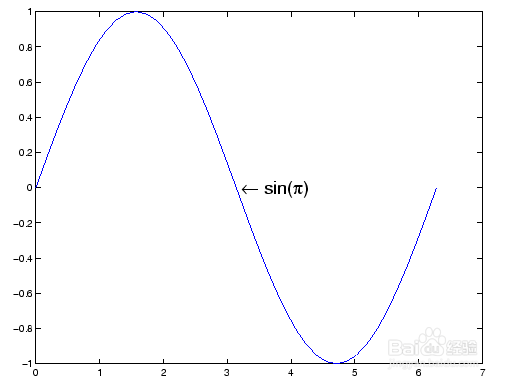
3、在下图中用字符串sin(π)标注点(pi,0):
plot(0:pi/20:2*pi,sin(0:pi/20:2*pi))
text(pi,0,' \leftarrow sin(\pi)','FontSize',18)
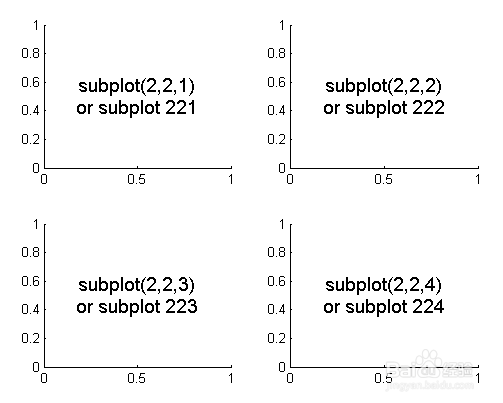
4、下图显示了四个子区域区域,并指示用于创建每个区域的命令。
figure
subplot(2,2,1)
text(.5,.5,{'subplot(2,2,1)';'or subplot 221'},...
'FontSize',14,'HorizontalAlignment','center')
subplot(2,2,2)
text(.5,.5,{'subplot(2,2,2)';'or subplot 222'},...
'FontSize',14,'HorizontalAlignment','center')
subplot(2,2,3)
text(.5,.5,{'subplot(2,2,3)';'or subplot 223'},...
'FontSize',14,'HorizontalAlignment','center')
subplot(2,2,4)
text(.5,.5,{'subplot(2,2,4)';'or subplot 224'},...
'FontSize',14,'HorizontalAlignment','center')
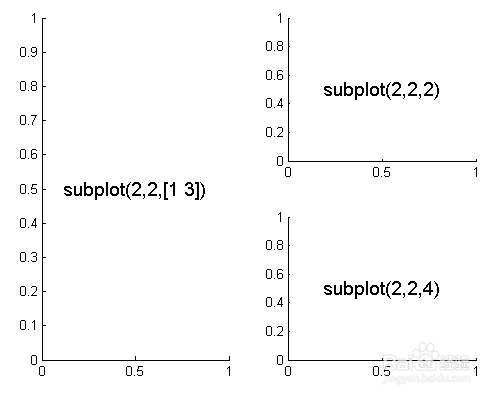
5、以下组合产生子图的不对称排列。
figure
subplot(2,2,[1 3])
text(.5,.5,'subplot(2,2,[1 3])',...
'FontSize',14,'HorizontalAlignment','center')
subplot(2,2,2)
text(.5,.5,'subplot(2,2,2)',...
'FontSize',14,'HorizontalAlignment','center')
subplot(2,2,4)
text(.5,.5,'subplot(2,2,4)',...
'FontSize',14,'HorizontalAlignment','center')
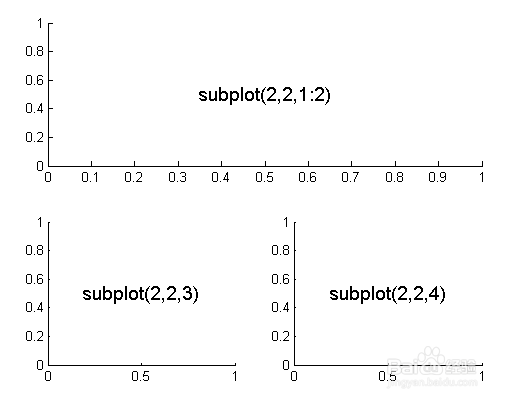
6、您也可以使用冒号运算符指定多个位置(如果它们是按顺序排列的话)。
figure
subplot(2,2,1:2)
text(.5,.5,'subplot(2,2,1:2)',...
'FontSize',14,'HorizontalAlignment','center')
subplot(2,2,3)
text(.5,.5,'subplot(2,2,3)',...
'FontSize',14,'HorizontalAlignment','center')
subplot(2,2,4)
text(.5,.5,'subplot(2,2,4)',...
'FontSize',14,'HorizontalAlignment','center')