jQuery EasyUI入门到精通(22)DataGrid(12)
1、Card View(卡片视图),DataGrid Card View Demo(数据表格卡片视图案例).The datagrid row can be showed as card(这种数据表格可以卡片的形式显示).
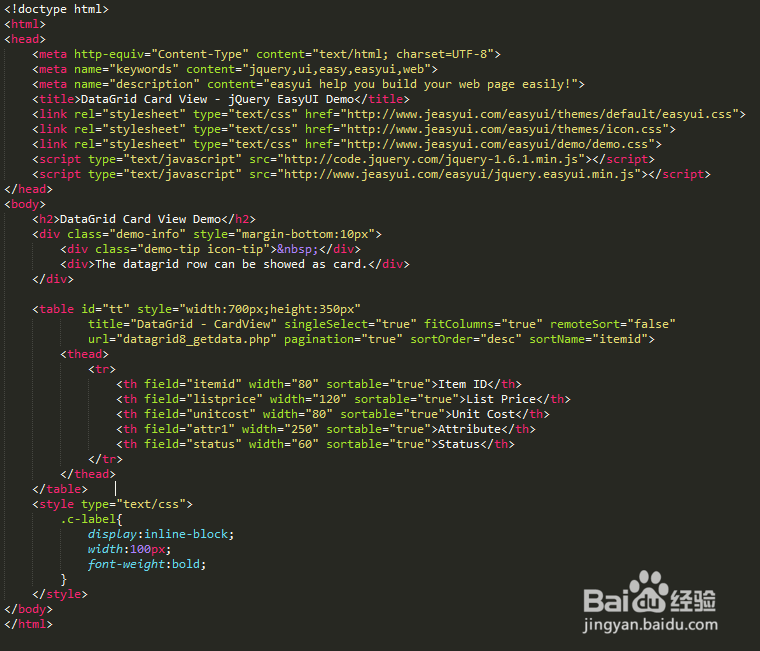
该案例,HTML基本结构如下所示:
<!doctype html>
<html>
<head>
<meta http-equiv="Content-Type" content="text/html; charset=UTF-8">
<meta name="keywords" content="jquery,ui,easy,easyui,web">
<meta name="description" content="easyui help you build your web page easily!">
<title>DataGrid Card View - jQuery EasyUI Demo</title>
<link rel="stylesheet" type="text/css" href="http://www.jeasyui.com/easyui/themes/default/easyui.css">
<link rel="stylesheet" type="text/css" href="http://www.jeasyui.com/easyui/themes/icon.css">
<link rel="stylesheet" type="text/css" href="http://www.jeasyui.com/easyui/demo/demo.css">
<script type="text/javascript" src="http://code.jquery.com/jquery-1.6.1.min.js"></script>
<script type="text/javascript" src="http://www.jeasyui.com/easyui/jquery.easyui.min.js"></script>
</head>
<body>
<h2>DataGrid Card View Demo</h2>
<div class="demo-info" style="margin-bottom:10px">
<div class="demo-tip icon-tip"> </div>
<div>The datagrid row can be showed as card.</div>
</div>
<table id="tt" style="width:700px;height:350px"
title="DataGrid - CardView" singleSelect="true" fitColumns="true" remoteSort="false"
url="datagrid8_getdata.php" pagination="true" sortOrder="desc" sortName="itemid">
<thead>
<tr>
<th field="itemid
<th field="listprice
<th field="unitcost
<th field="attr1
<th field="status
</tr>
</thead>
</table>
<style type="text/css">
.c-label{
display:inline-block;
width:100px;
font-weight:bold;
}
</style>
</body>
</html>
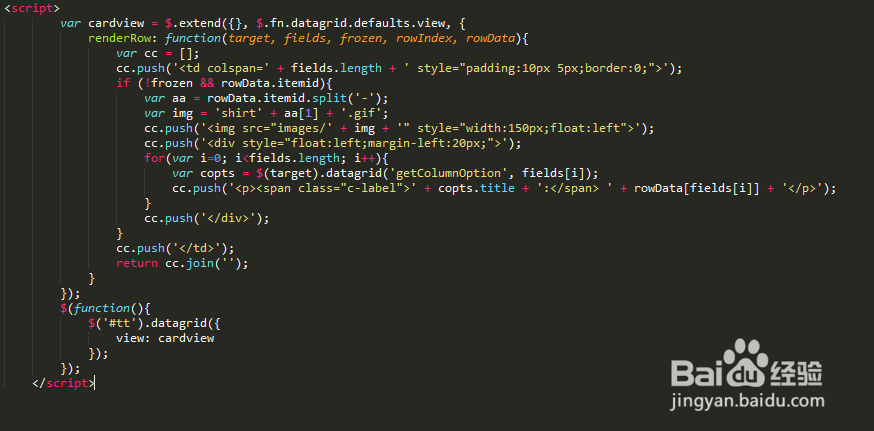
2、Card View(卡片视图),DataGrid Card View Demo(数据表格卡片视图案例),Javascript代码如下所示:
<script>
var cardview = $.extend({}, $.fn.datagrid.defaults.view, {
renderRow: function(target, fields, frozen, rowIndex, rowData){
var cc = [];
cc.push('<td colspan=' + fields.length + ' style="padding:10px 5px;border:0;">');
if (!frozen && rowData.itemid){
var aa = rowData.itemid.split('-');
var img = 'shirt' + aa[1] + '.gif';
cc.push('<img src="images/' + img + '" style="width:150px;float:left">');
cc.push('<div style="float:left;margin-left:20px;">');
for(var i=0; i<fields.length; i++){
var copts = $(target).datagrid('getColumnOption', fields[i]);
cc.push('<span class="c-label">' + copts.title + ':</span> ' + rowData[fields[i]] + '');
}
cc.push('</div>');
}
cc.push('</td>');
return cc.join('');
}
});
$(function(){
$('#tt').datagrid({
view: cardview
});
});
</script>
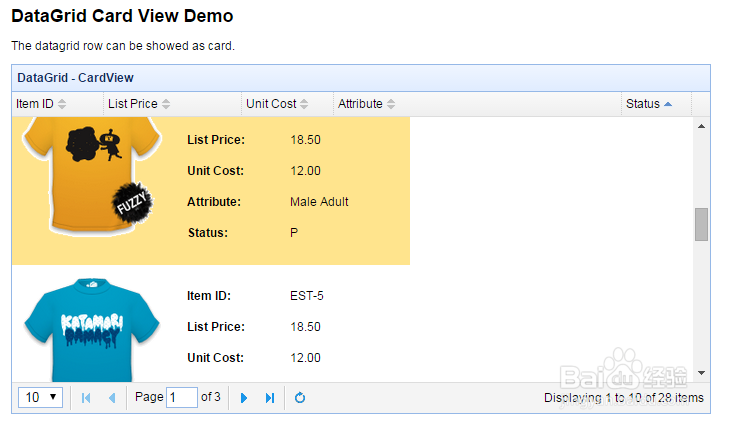
3、Card View(卡片视图),DataGrid Card View Demo(数据表格卡片视图案例),运行效果如下图所示。
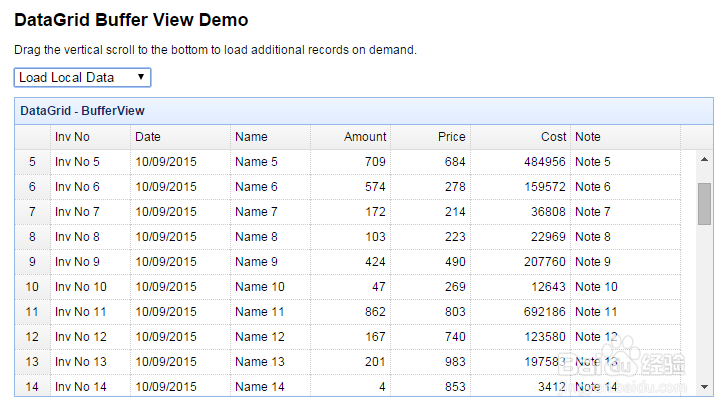
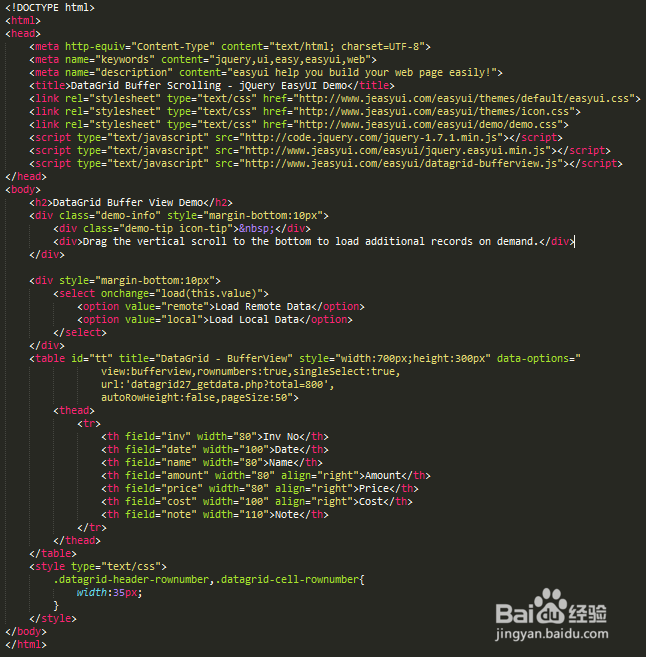
4、Buffer View(缓冲视图),DataGrid Buffer View Demo(数据表格缓冲视图案例),Drag the vertical scroll to the bottom to load additional records on demand(拖拽垂直滚动条到底部按需加载额外的记录).
HTML基本结构如下:
<!DOCTYPE html>
<html>
<head>
<meta http-equiv="Content-Type" content="text/html; charset=UTF-8">
<meta name="keywords" content="jquery,ui,easy,easyui,web">
<meta name="description" content="easyui help you build your web page easily!">
<title>DataGrid Buffer Scrolling - jQuery EasyUI Demo</title>
<link rel="stylesheet" type="text/css" href="http://www.jeasyui.com/easyui/themes/default/easyui.css">
<link rel="stylesheet" type="text/css" href="http://www.jeasyui.com/easyui/themes/icon.css">
<link rel="stylesheet" type="text/css" href="http://www.jeasyui.com/easyui/demo/demo.css">
<script type="text/javascript" src="http://code.jquery.com/jquery-1.7.1.min.js"></script>
<script type="text/javascript" src="http://www.jeasyui.com/easyui/jquery.easyui.min.js"></script>
<script type="text/javascript" src="http://www.jeasyui.com/easyui/datagrid-bufferview.js"></script>
</head>
<body>
<h2>DataGrid Buffer View Demo</h2>
<div class="demo-info" style="margin-bottom:10px">
<div class="demo-tip icon-tip"> </div>
<div>Drag the vertical scroll to the bottom to load additional records on demand.</div>
</div>
<div style="margin-bottom:10px">
<select onchange="load(this.value)">
<option value="remote">Load Remote Data</option>
<option value="local">Load Local Data</option>
</select>
</div>
<table id="tt" title="DataGrid - BufferView" style="width:700px;height:300px" data-options="
view:bufferview,rownumbers:true,singleSelect:true,
url:'datagrid27_getdata.php?total=800',
autoRowHeight:false,pageSize:50">
<thead>
<tr>
<th field="inv
<th field="date
<th field="name
<th field="amount
<th field="price
<th field="cost
<th field="note
</tr>
</thead>
</table>
<style type="text/css">
.datagrid-header-rownumber,.datagrid-cell-rownumber{
width:35px;
}
</style>
</body>
</html>
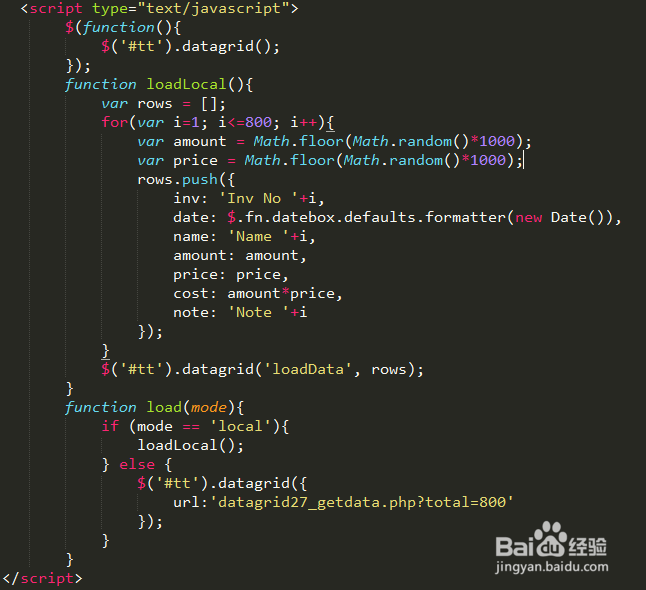
5、Buffer View(缓冲视图),DataGrid Buffer View Demo(数据表格缓冲视图案例),Javascript代码如下所示:
<script type="text/javascript">
$(function(){
$('#tt').datagrid();
});
function loadLocal(){
var rows = [];
for(var i=1; i<=800; i++){
var amount = Math.floor(Math.random()*1000);
var price = Math.floor(Math.random()*1000);
rows.push({
inv: 'Inv No '+i,
date: $.fn.datebox.defaults.formatter(new Date()),
name: 'Name '+i,
amount: amount,
price: price,
cost: amount*price,
note: 'Note '+i
});
}
$('#tt').datagrid('loadData', rows);
}
function load(mode){
if (mode == 'local'){
loadLocal();
} else {
$('#tt').datagrid({
url:'datagrid27_getdata.php?total=800'
});
}
}
</script>
6、Buffer View(缓冲视图),DataGrid Buffer View Demo(数据表格缓冲视图案例),运行效果如下图所示: