python 如何画一条阿基米德螺线?
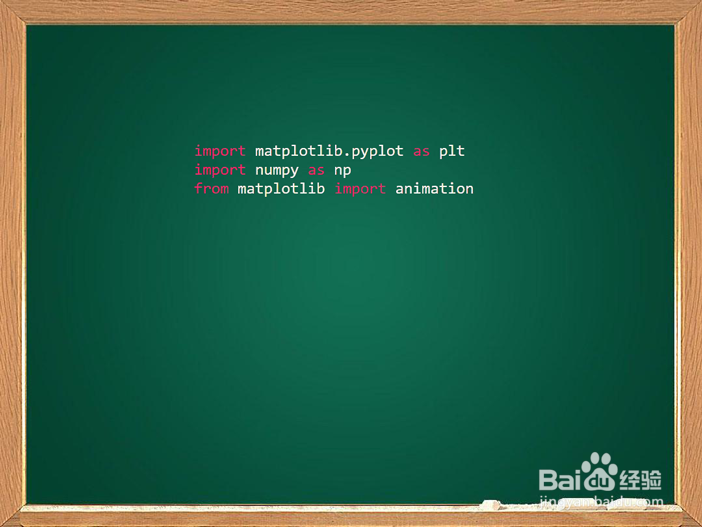
1、首先引入需要的python 模块:
2、其次设置figure的坐标系为极坐标,并设置半径的范围:

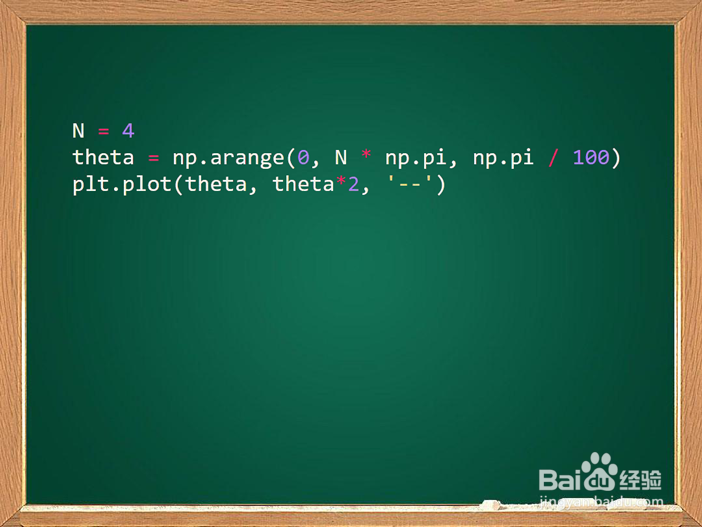
3、然后填充显示阿基米德螺线所需要的数据:
4、最后发送显示命令,准备显示:

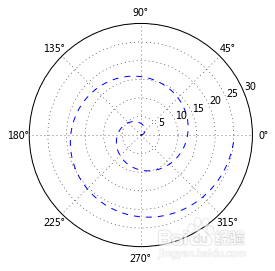
5、得到最终的示意图:
6、让我们通过动画来看一下阿基米德螺线的运动轨迹:
1、简单版本:
import matplotlib.pyplot as plt
import numpy as np
from matplotlib import animation
plt.subplot(111, polar=True)
plt.ylim([0, 30])
N = 4
theta = np.arange(0, N * np.pi, np.pi / 100)
plt.plot(theta, theta*2, '--')
plt.show()
2、带动画的阿基米德螺线:
import matplotlib.pyplot as plt
import numpy as np
from matplotlib import animation
fig = plt.figure()
plt.subplot(111, polar=True)
plt.ylim([0, 30])
line, = plt.plot([], [], '--')
def init():
line.set_data([], [])
return line,
def animate(i):
if i!=0:
theta = np.arange(0, i * np.pi, np.pi / 100)
line.set_data(theta, theta*3)
return line,
anim = animation.FuncAnimation(fig, animate, init_func=init,
frames=8, interval=300, blit=True)
plt.show()