Mathematica基础——ContourPlot的选项(续)
1、 用PlotLegends来增加图形的图例:
ContourPlot[Sin[6 x + y] Cos[x - 6 y], {x, 0, Pi}, {y, 0, Pi},
PlotLegends -> Automatic]
等高线的数量越多,图例越多:
Table[ContourPlot[Sin[6 x + y] Cos[x - 6 y], {x, 0, Pi}, {y, 0, Pi},
Contours -> c, PlotLegends -> Automatic], {c, {5, 10, 20}}]


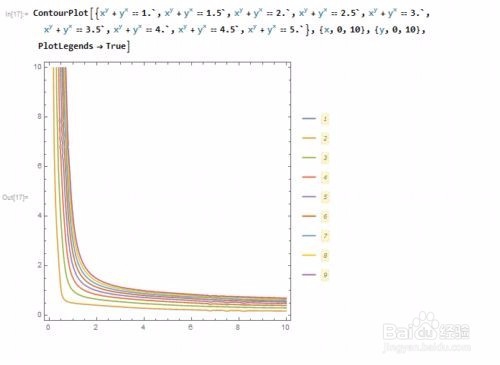
2、 当在一幅图里绘制多条隐函数图像时,可以给不同的图像,加上图例,并且颜色是相互匹配的:
ContourPlot[{x^y + y^x == 1.`, x^y + y^x == 1.5`, x^y + y^x == 2.`,
x^y + y^x == 2.5`, x^y + y^x == 3.`, x^y + y^x == 3.5`,
x^y + y^x == 4.`, x^y + y^x == 4.5`, x^y + y^x == 5.`}, {x, 0,
10}, {y, 0, 10}, PlotLegends -> True]
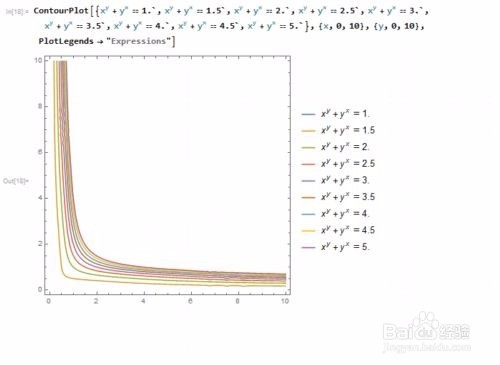
或者用PlotLegends -> "Expressions"来把图例显示为具体的表达式:
ContourPlot[{x^y + y^x == 1.`, x^y + y^x == 1.5`, x^y + y^x == 2.`,
x^y + y^x == 2.5`, x^y + y^x == 3.`, x^y + y^x == 3.5`,
x^y + y^x == 4.`, x^y + y^x == 4.5`, x^y + y^x == 5.`}, {x, 0,
10}, {y, 0, 10}, PlotLegends -> "Expressions"]
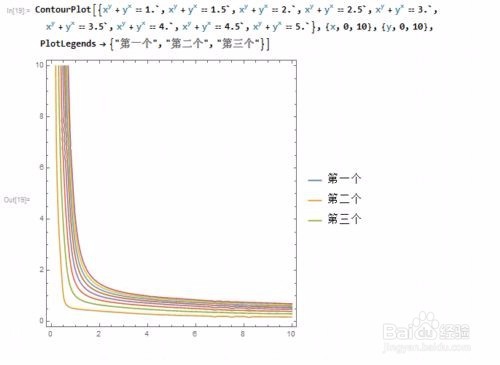
3、 还可以指定图例所要显示的内容:
ContourPlot[{x^y + y^x == 1.`, x^y + y^x == 1.5`, x^y + y^x == 2.`,
x^y + y^x == 2.5`, x^y + y^x == 3.`, x^y + y^x == 3.5`,
x^y + y^x == 4.`, x^y + y^x == 4.5`, x^y + y^x == 5.`}, {x, 0,
10}, {y, 0, 10}, PlotLegends -> {"第一个", "第二个", "第三个"}]
后面的那些图的图例,大家可以自己写。
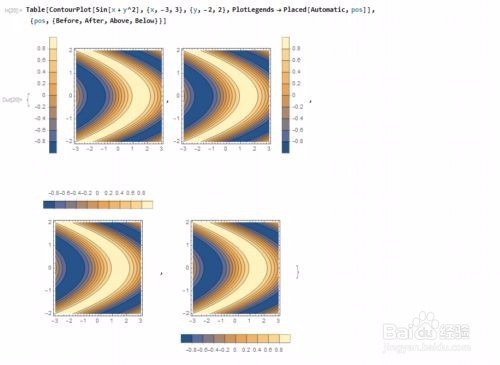
4、 用Placed可以改变图例放置的位置:
Table[ContourPlot[Sin[x + y^2], {x, -3, 3}, {y, -2, 2},
PlotLegends -> Placed[Automatic, pos]], {pos,
{Before, After, Above,Below}}]
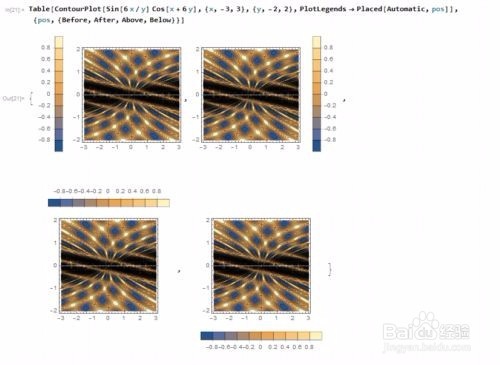
或
Table[ContourPlot[Sin[6 x/y] Cos[x + 6 y], {x, -3, 3}, {y, -2, 2},
PlotLegends -> Placed[Automatic, pos]],
{pos, {Before, After, Above,Below}}]
把图例非别放在前边、后边、上边、下边。
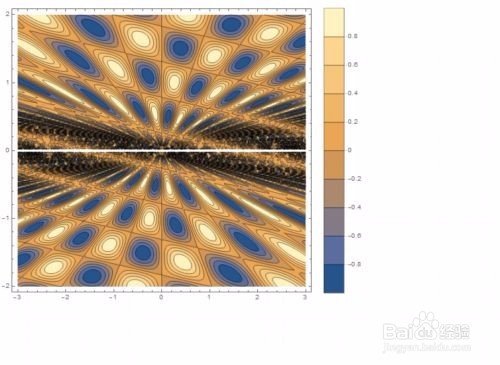
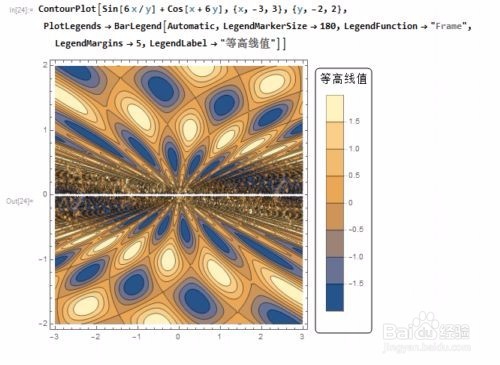
5、 用BarLegend(酒吧的传说)可以改变图例的具体样式,
ContourPlot[Sin[6 x/y] + Cos[x + 6 y], {x, -3, 3}, {y, -2, 2},
PlotLegends ->
BarLegend[Automatic, LegendMarkerSize -> 180,
LegendFunction -> "Frame", LegendMargins -> 5,
LegendLabel -> "等高线值"]]