如何在vue项目实现图表---vue-schart(饼状图)
1、安装vue-schart插件
npm i vue-schart -S

2、检查是否安装成功
查看配置文件package.json文件是否有vue-schart版本信息

3、启动项目
npm run dev

4、在chart.vue中引入vue-schart
import Schart from 'vue-schart';

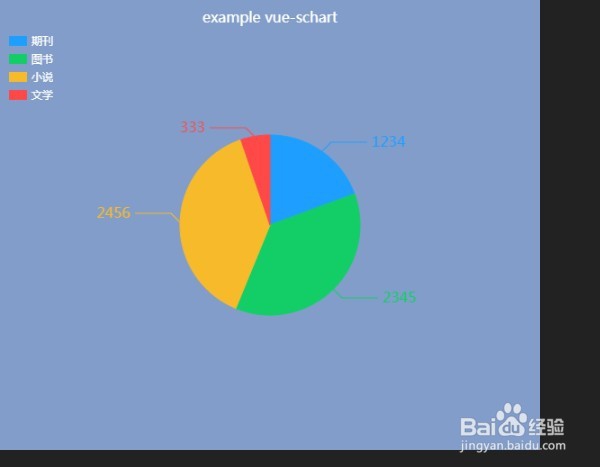
5、模拟饼状图数据信息
export default {
data() {
return {
canvasId: 'myChart',
type: 'pie',
width: 600,
height: 500,
data: [
{name: '期刊', value: 1234},
{name: '图书', value: 2345},
{name: '小说', value: 2456},
{name: '文学', value: 333},
],
options: {
title: 'example vue-schart',
bgColor: '#829dca',
titleColor: '#ffffff',
legendColor: '#ffffff'
}
}
},
components:{
Schart
}
}

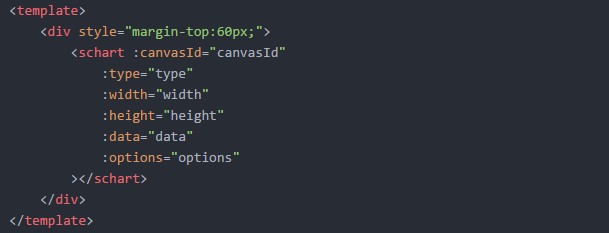
6、组件:
<schart :canvasId="canvasId"
:type="type"
:width="width"
:height="height"
:data="data"
:options="options"
>
</schart>
7、查看效果
8、注:下面是vue-schart的options几个属性的表达意思
padding: 44, // canvas 内边距
bgColor: '#FFF', // 默认背景颜色
title: 'example vue-schart',// 图表标题
titleColor: '#000', // 图表标题颜色
titlePosition: 'top' // 图表标题位置: top / bottom
yEqual: 5, // y轴分成5等分
fillColor: '#1E9FFF', // 默认填充颜色
contentColor: '#eee', // 内容横线颜色
axisColor: '#666', // 坐标轴颜色
