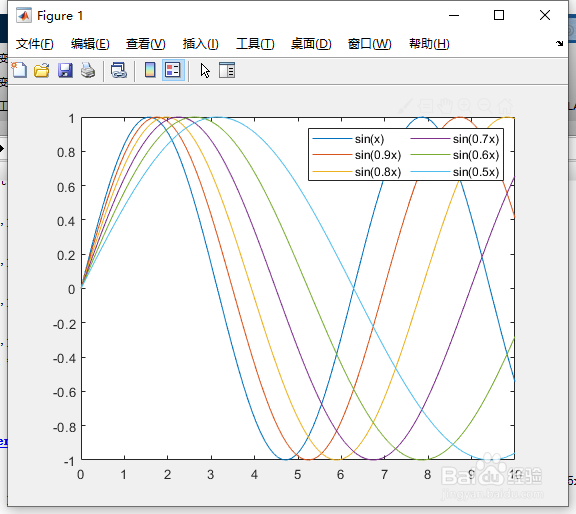
如何画具有多列的图例?
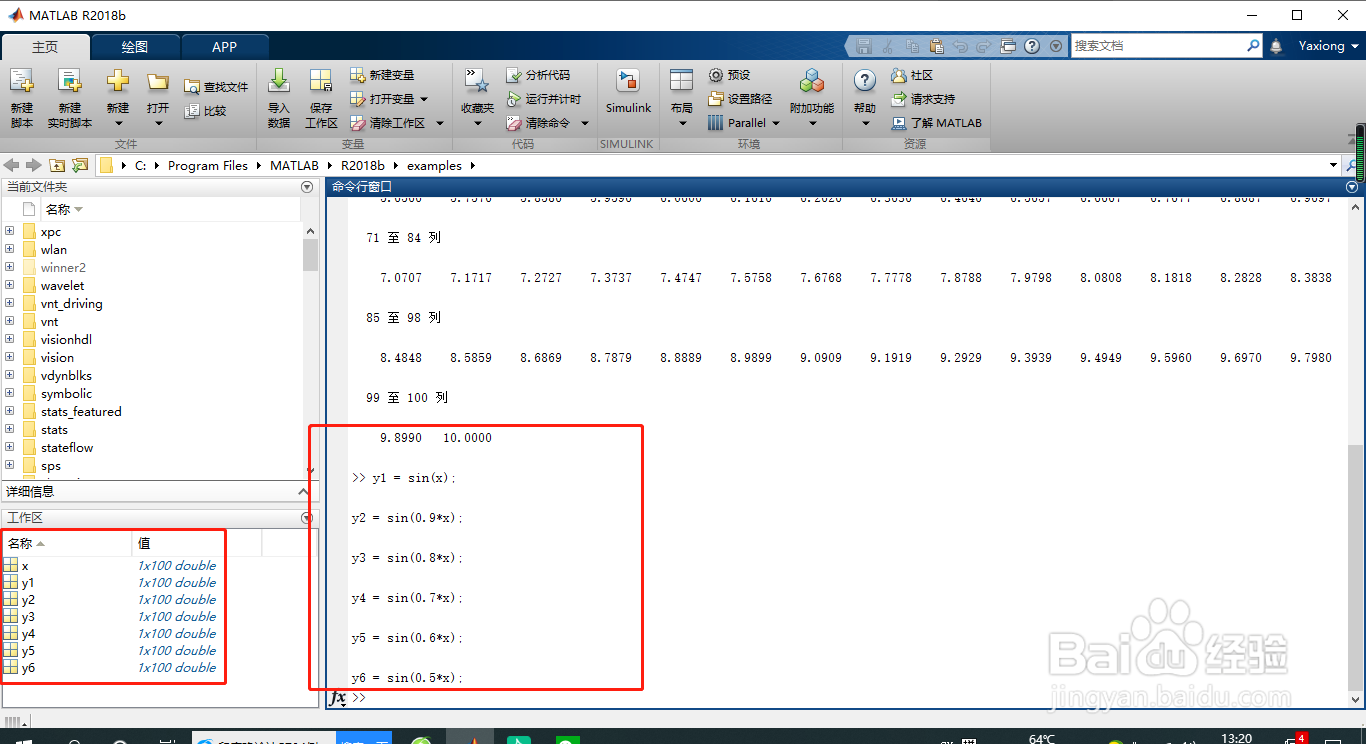
1、命令行键入:
x = linspace(0,10);
%定义x。

2、命令行键入:
y1 = sin(x);
y2 = sin(0.9*x);
y3 = sin(0.8*x);
y4 = sin(0.7*x);
y5 = sin(0.6*x);
y6 = sin(0.5*x);
%定义y1,y2,y3,y4,y5,y6。
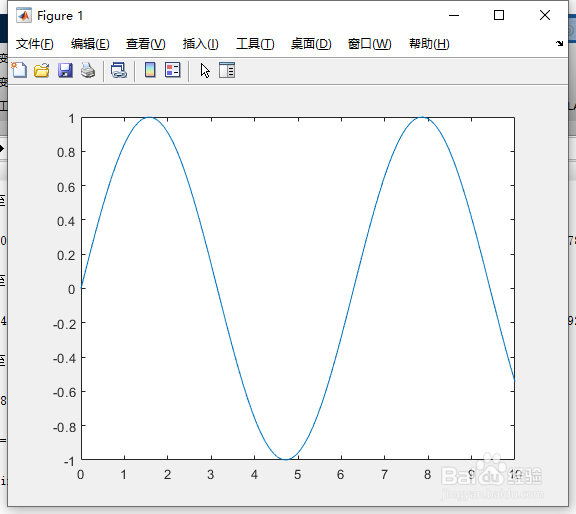
3、命令行键入:
plot(x,y1,'DisplayName','sin(x)')
%画图。
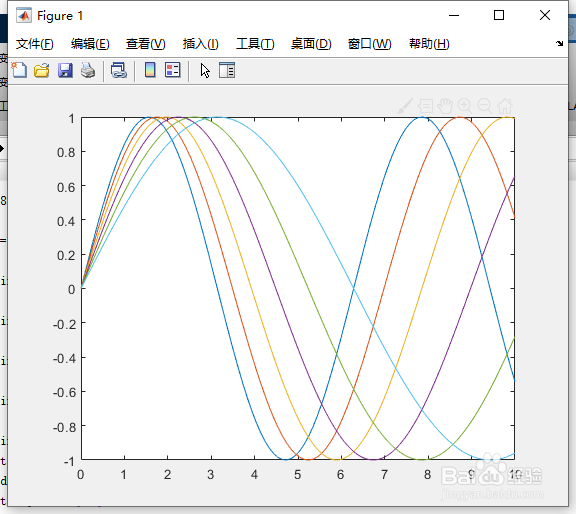
4、命令行键入:
hold on
%图形保持。
5、命令行键入:
plot(x,y2,'DisplayName','sin(0.9x)')
plot(x,y3,'DisplayName','sin(0.8x)')
plot(x,y4,'DisplayName','sin(0.7x)')
plot(x,y5,'DisplayName','sin(0.6x)')
plot(x,y6,'DisplayName','sin(0.5x)')
%画图。
6、命令行键入:
hold off
%取消保持
7、命令行键入:
lgd = legend;
%标签。
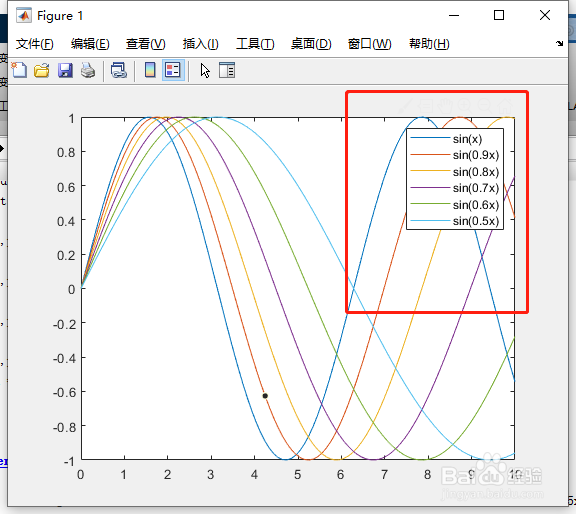
8、命令行键入:
lgd.NumColumns = 2;
%通过将 NumColumns 属性设置为 2 来添加一个具有两列的图例。
声明:本网站引用、摘录或转载内容仅供网站访问者交流或参考,不代表本站立场,如存在版权或非法内容,请联系站长删除,联系邮箱:site.kefu@qq.com。
阅读量:56
阅读量:52
阅读量:68
阅读量:149
阅读量:188