【Mathematica入门】Plot函数图像的图例
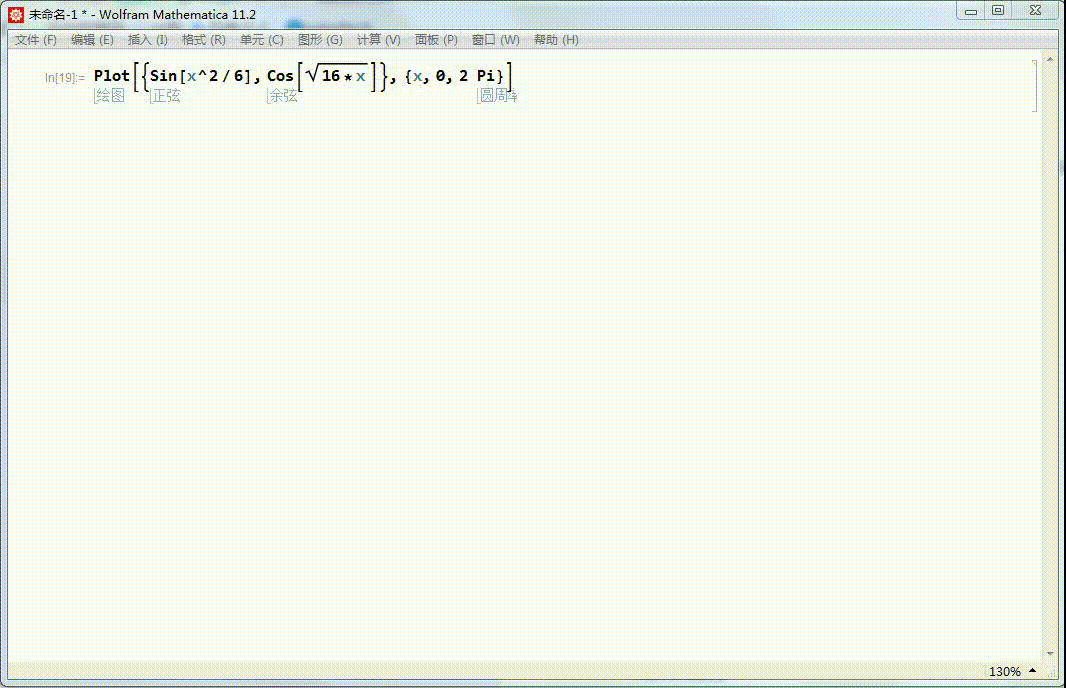
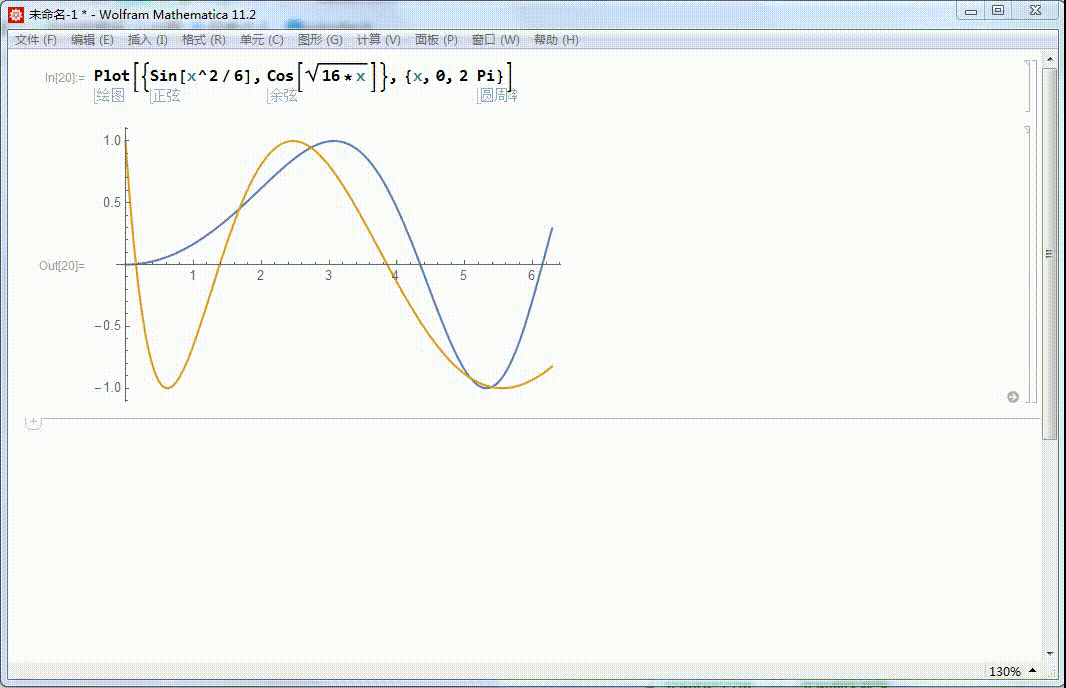
1、先来绘制两条曲线:
Plot[{Sin[x^2/6], Cos[Sqrt[16*x]]}, {x, 0, 2 Pi}]
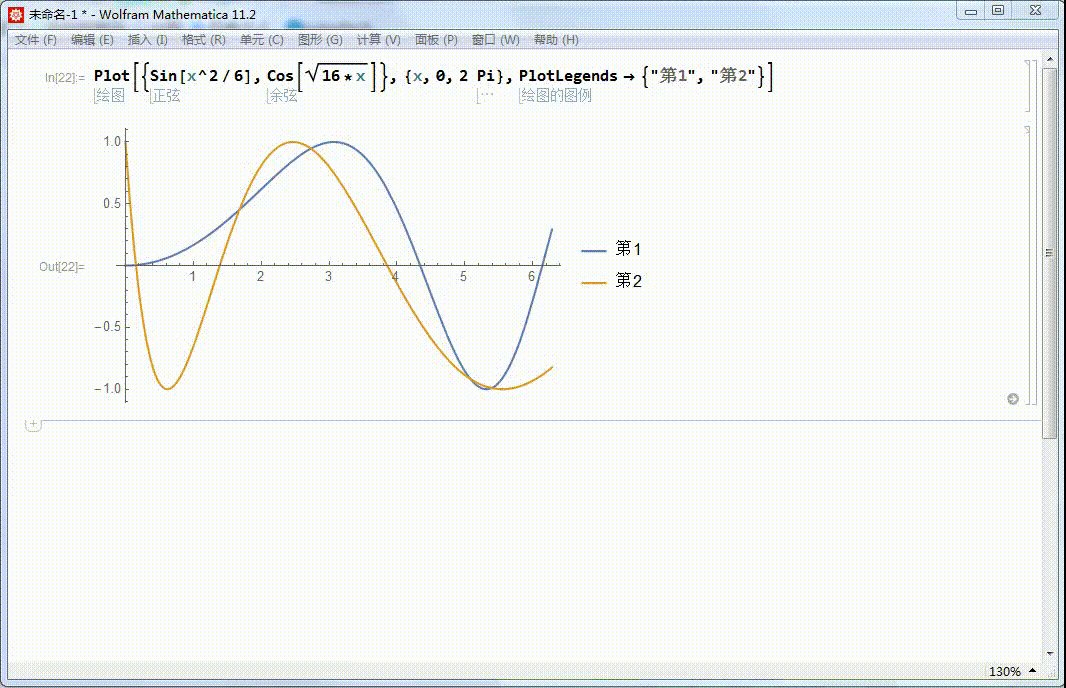
2、添加图例,需要使用选项:PlotLegends 。
如果想用函数的解析式作为图例,可以指定为:
PlotLegends -> "Expressions"
图例默认加载图像的右边。
3、如果想要使用别的字符作为图例,需要专门指定:
PlotLegends -> {"第1", "第2"}

4、如果想把图例放到图像上面,需要使用Placed指定:
PlotLegends -> Placed[{"第1", "第2"}, Above]
5、如果想把图例放在图内某个具体的位置,需要指定其坐标:
PlotLegends -> Placed[{"第1", "第2"}, {0.36, 0.25}]

声明:本网站引用、摘录或转载内容仅供网站访问者交流或参考,不代表本站立场,如存在版权或非法内容,请联系站长删除,联系邮箱:site.kefu@qq.com。
阅读量:104
阅读量:36
阅读量:191
阅读量:137
阅读量:134