Chart.js使用教程
1、首先我们需要在页面中引入Chart.js文件。此工具库在全局命名空间中定义了Chart变量。
<script src="Chart.js"></script>
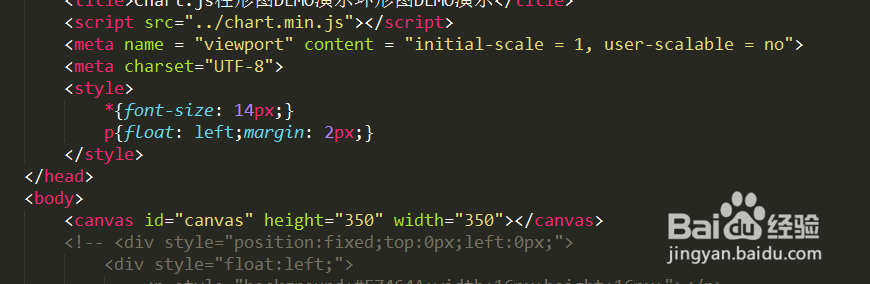
2、为了创建图表,我们要实例化一个canvas
<canvas id="canvas" height="350

3、我们还可以用jQuery获取canvas的context。首先从jQuery集合中获取我们需要的DOM节点,然后在这个DOM节点上调用 getContext("2d")方法。
var ctx = document.getElementById("canvas").getContext("2d");
myNewChart_4 = new Chart(ctx).Doughnut(doughnutData, doughnutOptions);

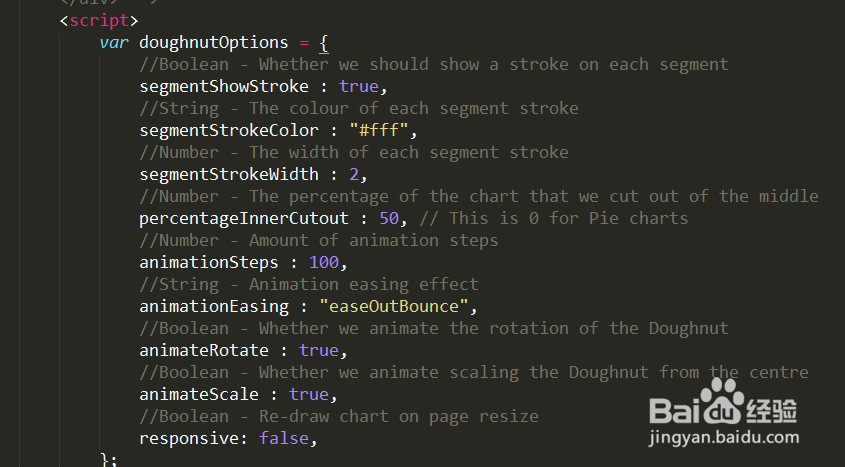
4、定义doughnutOptions
var doughnutOptions = {
//Boolean - Whether we should show a stroke on each segment
segmentShowStroke : true,
//String - The colour of each segment stroke
segmentStrokeColor : "#fff",
//Number - The width of each segment stroke
segmentStrokeWidth : 2,
//Number - The percentage of the chart that we cut out of the middle
percentageInnerCutout : 50, // This is 0 for Pie charts
//Number - Amount of animation steps
animationSteps : 100,
//String - Animation easing effect
animationEasing : "easeOutBounce",
//Boolean - Whether we animate the rotation of the Doughnut
animateRotate : true,
//Boolean - Whether we animate scaling the Doughnut from the centre
animateScale : true,
//Boolean - Re-draw chart on page resize
responsive: false,
};
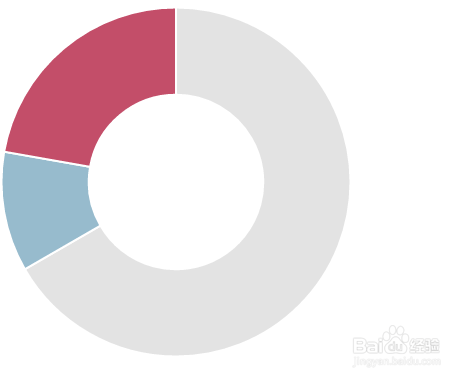
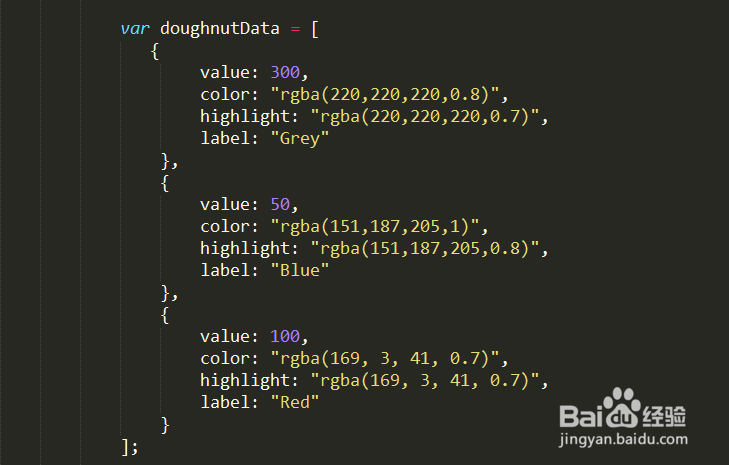
5、定义doughnutData
var doughnutData = [
{
value: 300,
color: "rgba(220,220,220,0.8)",
highlight: "rgba(220,220,220,0.7)",
label: "Grey"
},
{
value: 50,
color: "rgba(151,187,205,1)",
highlight: "rgba(151,187,205,0.8)",
label: "Blue"
},
{
value: 100,
color: "rgba(169, 3, 41, 0.7)",
highlight: "rgba(169, 3, 41, 0.7)",
label: "Red"
}
];
6、完成圆形