百度echarts柱状图(二)
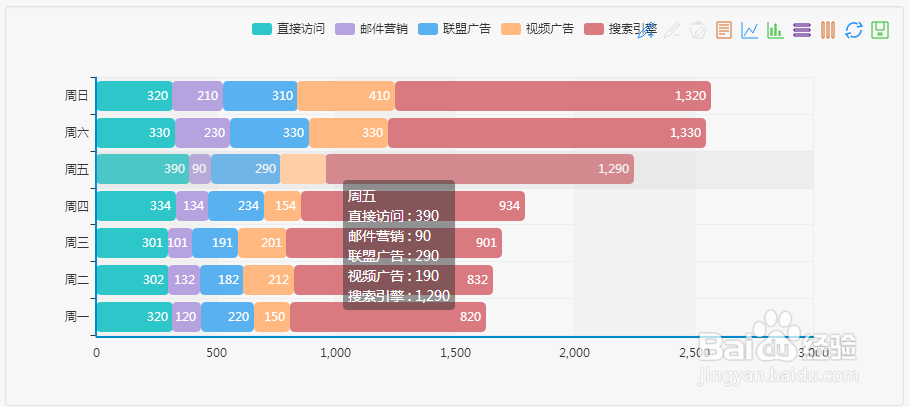
1、堆积条形图,任意系列多维度堆积,代码如下:
option = {
tooltip : {
trigger: 'axis',
axisPointer : { // 坐标轴指示器,坐标轴触发有效
type : 'shadow' // 默认为直线,可选为:'line' | 'shadow'
}
},
legend: {
data:['直接访问', '邮件营销','联盟广告','视频广告','搜索引擎']
},
toolbox: {
show : true,
feature : {
mark : {show: true},
dataView : {show: true, readOnly: false},
magicType : {show: true, type: ['line', 'bar', 'stack', 'tiled']},
restore : {show: true},
saveAsImage : {show: true}
}
},
calculable : true,
xAxis : [
{
type : 'value'
}
],
yAxis : [
{
type : 'category',
data : ['周一','周二','周三','周四','周五','周六','周日']
}
],
series : [
{
name:'直接访问',
type:'bar',
stack: '总量',
itemStyle : { normal: {label : {show: true, position: 'insideRight'}}},
data:[320, 302, 301, 334, 390, 330, 320]
},
{
name:'邮件营销',
type:'bar',
stack: '总量',
itemStyle : { normal: {label : {show: true, position: 'insideRight'}}},
data:[120, 132, 101, 134, 90, 230, 210]
},
{
name:'联盟广告',
type:'bar',
stack: '总量',
itemStyle : { normal: {label : {show: true, position: 'insideRight'}}},
data:[220, 182, 191, 234, 290, 330, 310]
},
{
name:'视频广告',
type:'bar',
stack: '总量',
itemStyle : { normal: {label : {show: true, position: 'insideRight'}}},
data:[150, 212, 201, 154, 190, 330, 410]
},
{
name:'搜索引擎',
type:'bar',
stack: '总量',
itemStyle : { normal: {label : {show: true, position: 'insideRight'}}},
data:[820, 832, 901, 934, 1290, 1330, 1320]
}
]
};

2、标准条形图,横纵坐标轴互换,代码如下:
option = {
title : {
text: '世界人口总量',
subtext: '数据来自网络'
},
tooltip : {
trigger: 'axis'
},
legend: {
data:['2011年', '2012年']
},
toolbox: {
show : true,
feature : {
mark : {show: true},
dataView : {show: true, readOnly: false},
magicType: {show: true, type: ['line', 'bar']},
restore : {show: true},
saveAsImage : {show: true}
}
},
calculable : true,
xAxis : [
{
type : 'value',
boundaryGap : [0, 0.01]
}
],
yAxis : [
{
type : 'category',
data : ['巴西','印尼','美国','印度','中国','世界人口(万)']
}
],
series : [
{
name:'2011年',
type:'bar',
data:[18203, 23489, 29034, 104970, 131744, 630230]
},
{
name:'2012年',
type:'bar',
data:[19325, 23438, 31000, 121594, 134141, 681807]
}
]
};

3、多系列层叠,个性化样式,代码如下:
option = {
title : {
text: 'ECharts2 vs ECharts1',
subtext: 'Chrome下测试数据'
},
tooltip : {
trigger: 'axis'
},
legend: {
data:[
'ECharts1 - 2k数据','ECharts1 - 2w数据','ECharts1 - 20w数据','',
'ECharts2 - 2k数据','ECharts2 - 2w数据','ECharts2 - 20w数据'
]
},
toolbox: {
show : true,
feature : {
mark : {show: true},
dataView : {show: true, readOnly: false},
magicType : {show: true, type: ['line', 'bar']},
restore : {show: true},
saveAsImage : {show: true}
}
},
calculable : true,
grid: {y: 70, y2:30, x2:20},
xAxis : [
{
type : 'category',
data : ['Line','Bar','Scatter','K','Map']
},
{
type : 'category',
axisLine: {show:false},
axisTick: {show:false},
axisLabel: {show:false},
splitArea: {show:false},
splitLine: {show:false},
data : ['Line','Bar','Scatter','K','Map']
}
],
yAxis : [
{
type : 'value',
axisLabel:{formatter:'{value} ms'}
}
],
series : [
{
name:'ECharts2 - 2k数据',
type:'bar',
itemStyle: {normal: {color:'rgba(193,35,43,1)', label:{show:true}}},
data:[40,155,95,75, 0]
},
{
name:'ECharts2 - 2w数据',
type:'bar',
itemStyle: {normal: {color:'rgba(181,195,52,1)', label:{show:true,textStyle:{color:'#27727B'}}}},
data:[100,200,105,100,156]
},
{
name:'ECharts2 - 20w数据',
type:'bar',
itemStyle: {normal: {color:'rgba(252,206,16,1)', label:{show:true,textStyle:{color:'#E87C25'}}}},
data:[906,911,908,778,0]
},
{
name:'ECharts1 - 2k数据',
type:'bar',
xAxisIndex:1,
itemStyle: {normal: {color:'rgba(193,35,43,0.5)', label:{show:true,formatter:function(p){return p.value > 0 ? (p.value +'\n'):'';}}}},
data:[96,224,164,124,0]
},
{
name:'ECharts1 - 2w数据',
type:'bar',
xAxisIndex:1,
itemStyle: {normal: {color:'rgba(181,195,52,0.5)', label:{show:true}}},
data:[491,2035,389,955,347]
},
{
name:'ECharts1 - 20w数据',
type:'bar',
xAxisIndex:1,
itemStyle: {normal: {color:'rgba(252,206,16,0.5)', label:{show:true,formatter:function(p){return p.value > 0 ? (p.value +'+'):'';}}}},
data:[3000,3000,2817,3000,0]
}
]
};

4、标准条形图,横纵坐标轴互换,如下图所示:

5、堆积条形图,任意系列多维度堆积,如下图所示:
6、多维条形图,个性化样式,文本标签显示,透明数据驱动样式,如下图所示:

7、旋风条形图,正负值混合,如下图所示:

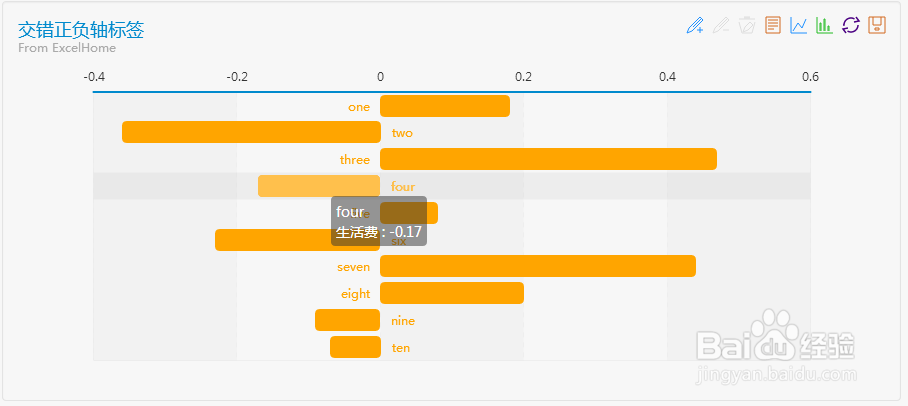
8、旋风条形图,正负值混合,交错正负轴标签,如下图所示:
9、不等据柱形图,双数数轴,如下图所示:

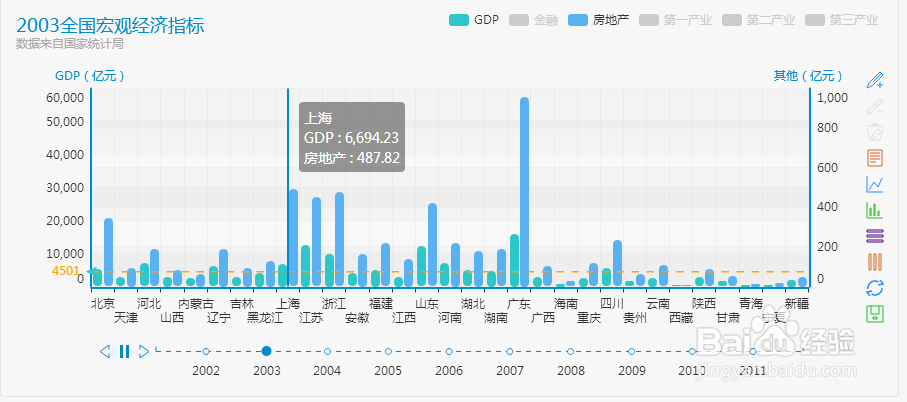
10、搭配时间轴,时空维度的数据展现,如下图所示:
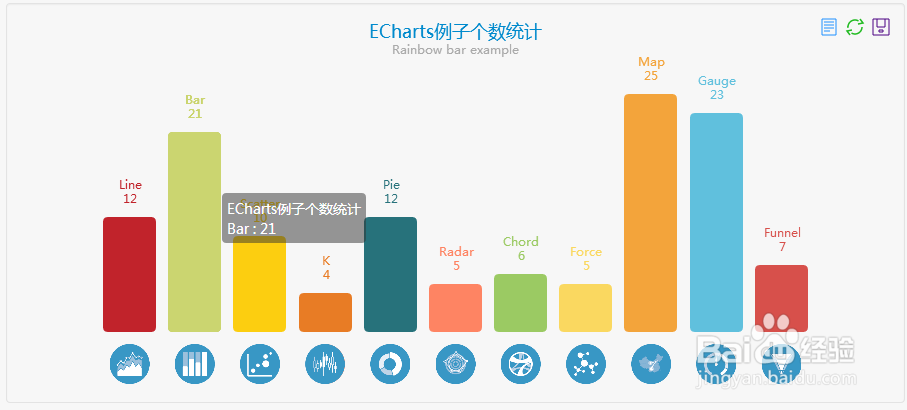
11、彩虹柱形图,个性化,如下图所示:
12、多系列彩虹柱形图,如下图所示:
13、柱状图,个性化,柱形宽度,填充、高亮、文本样式等,如下图所示:
