matlab怎么在一个图形界面中绘制多个坐标轴
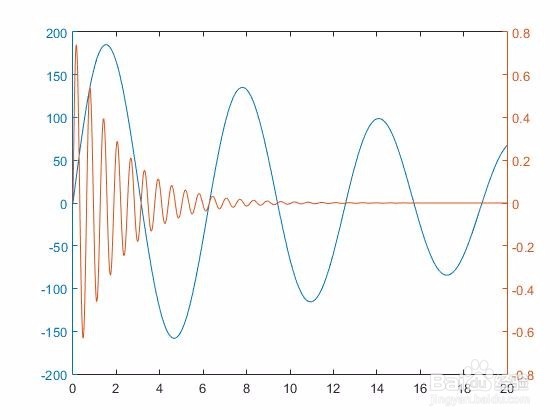
1、在同一个坐标轴中绘制多组数据。
如在同一个坐标轴中绘制y1 = 200*exp(-0.05*x).*sin(x);和y2 = 0.8*exp(-0.5*x).*sin(10*x);

2、第一种方法:使用plotyy函数。
函数格式:
plotyy(X1,Y1,X2,Y2)plotyy(X1,Y1,X2,Y2,function)plotyy(X1,Y1,X2,Y2,'function1','function2')[AX,H1,H2] = plotyy(...)
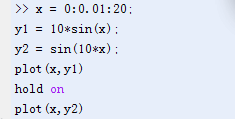
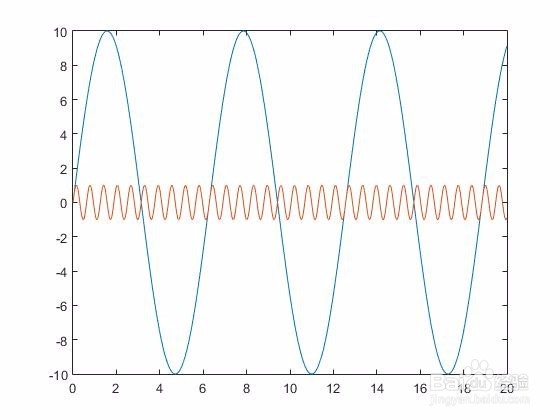
3、第二种方法:使用hold on。
如绘制
y1 = 10*sin(x);
y2 = sin(10*x);
4、如需绘制多条,可继续hold on
1、使用subplot函数
函数格式:
subplot(m,n,p)example
subplot(m,n,p,'replace')example
subplot(m,n,p,'align')
subplot('Position',positionVector)example
subplot(m,n,p,ax)example
subplot(___,Name,Value)
h = subplot(___)example
subplot(h)
2、如绘制:
y1 = 10*sin(x);
y2 = sin(10*x);
3、代码如下
x = 0:0.01:20;
y1 = 10*sin(x);
y2 = sin(10*x);
subplot(2,1,1)
plot(x,y1)
subplot(2,1,2)
plot(x,y2)

4、subplot(a,b,c)
参数解释:
a,b表示行和列
c表示第几个
subplot(2,1,1)
绘制一个两行一列的第一个图形
subplot(2,1,2)
绘制一个两行一列的第二个图形
声明:本网站引用、摘录或转载内容仅供网站访问者交流或参考,不代表本站立场,如存在版权或非法内容,请联系站长删除,联系邮箱:site.kefu@qq.com。
阅读量:190
阅读量:95
阅读量:33
阅读量:118
阅读量:172