设置matplotlib的绘图风格
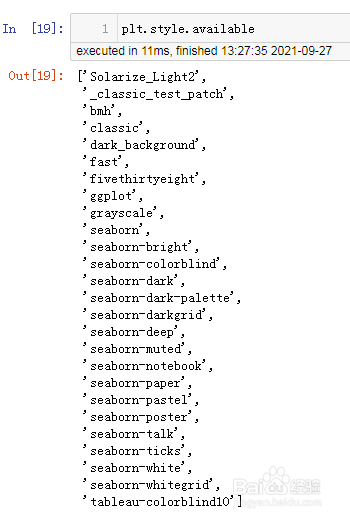
1、设定样式前可先查看matplotlib有哪些样式,使用函数plt.style.available查看可用的样式,结果列出了27种style,如下图。
2、设定样式需要使用函数:plt.style.use(),在括号中指定需要的样式:
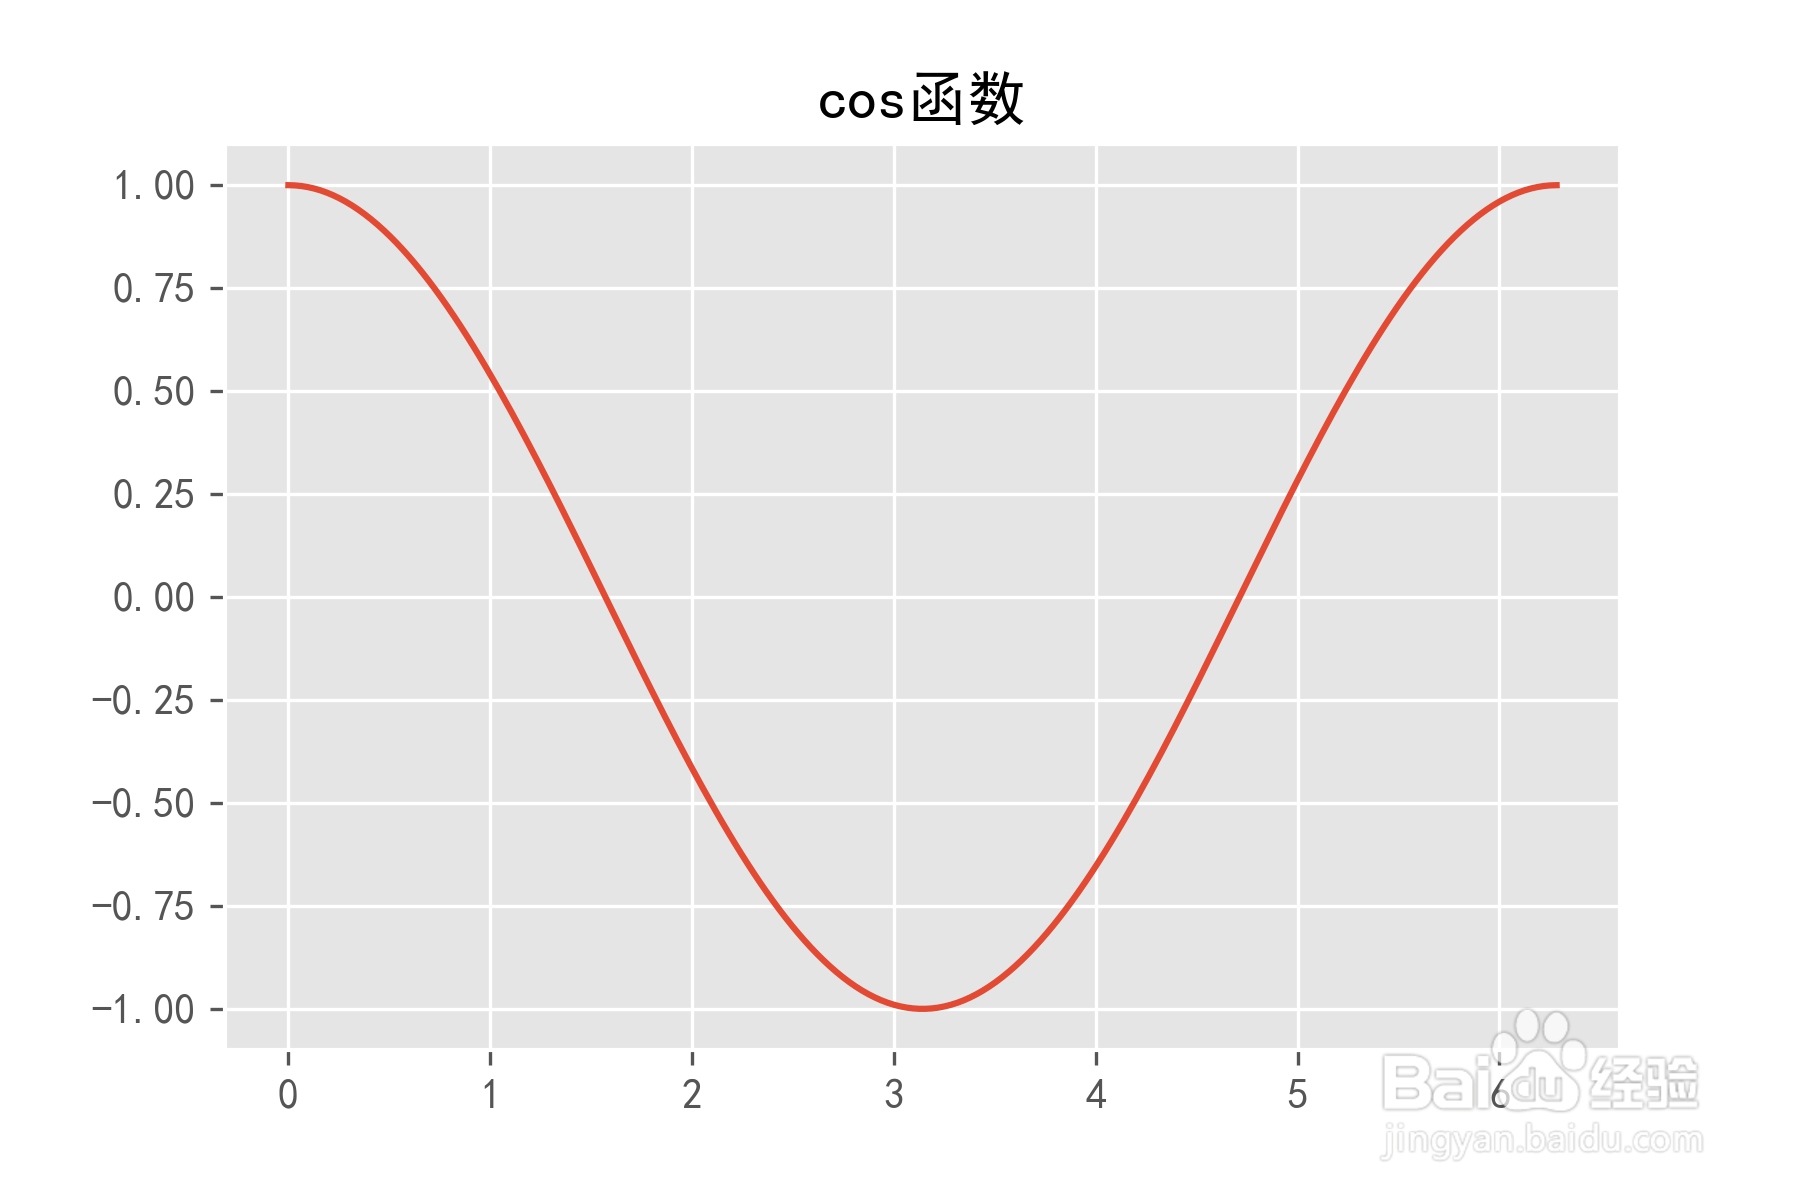
例如:plt.style.use('ggplot')
然后再运行绘图代码:
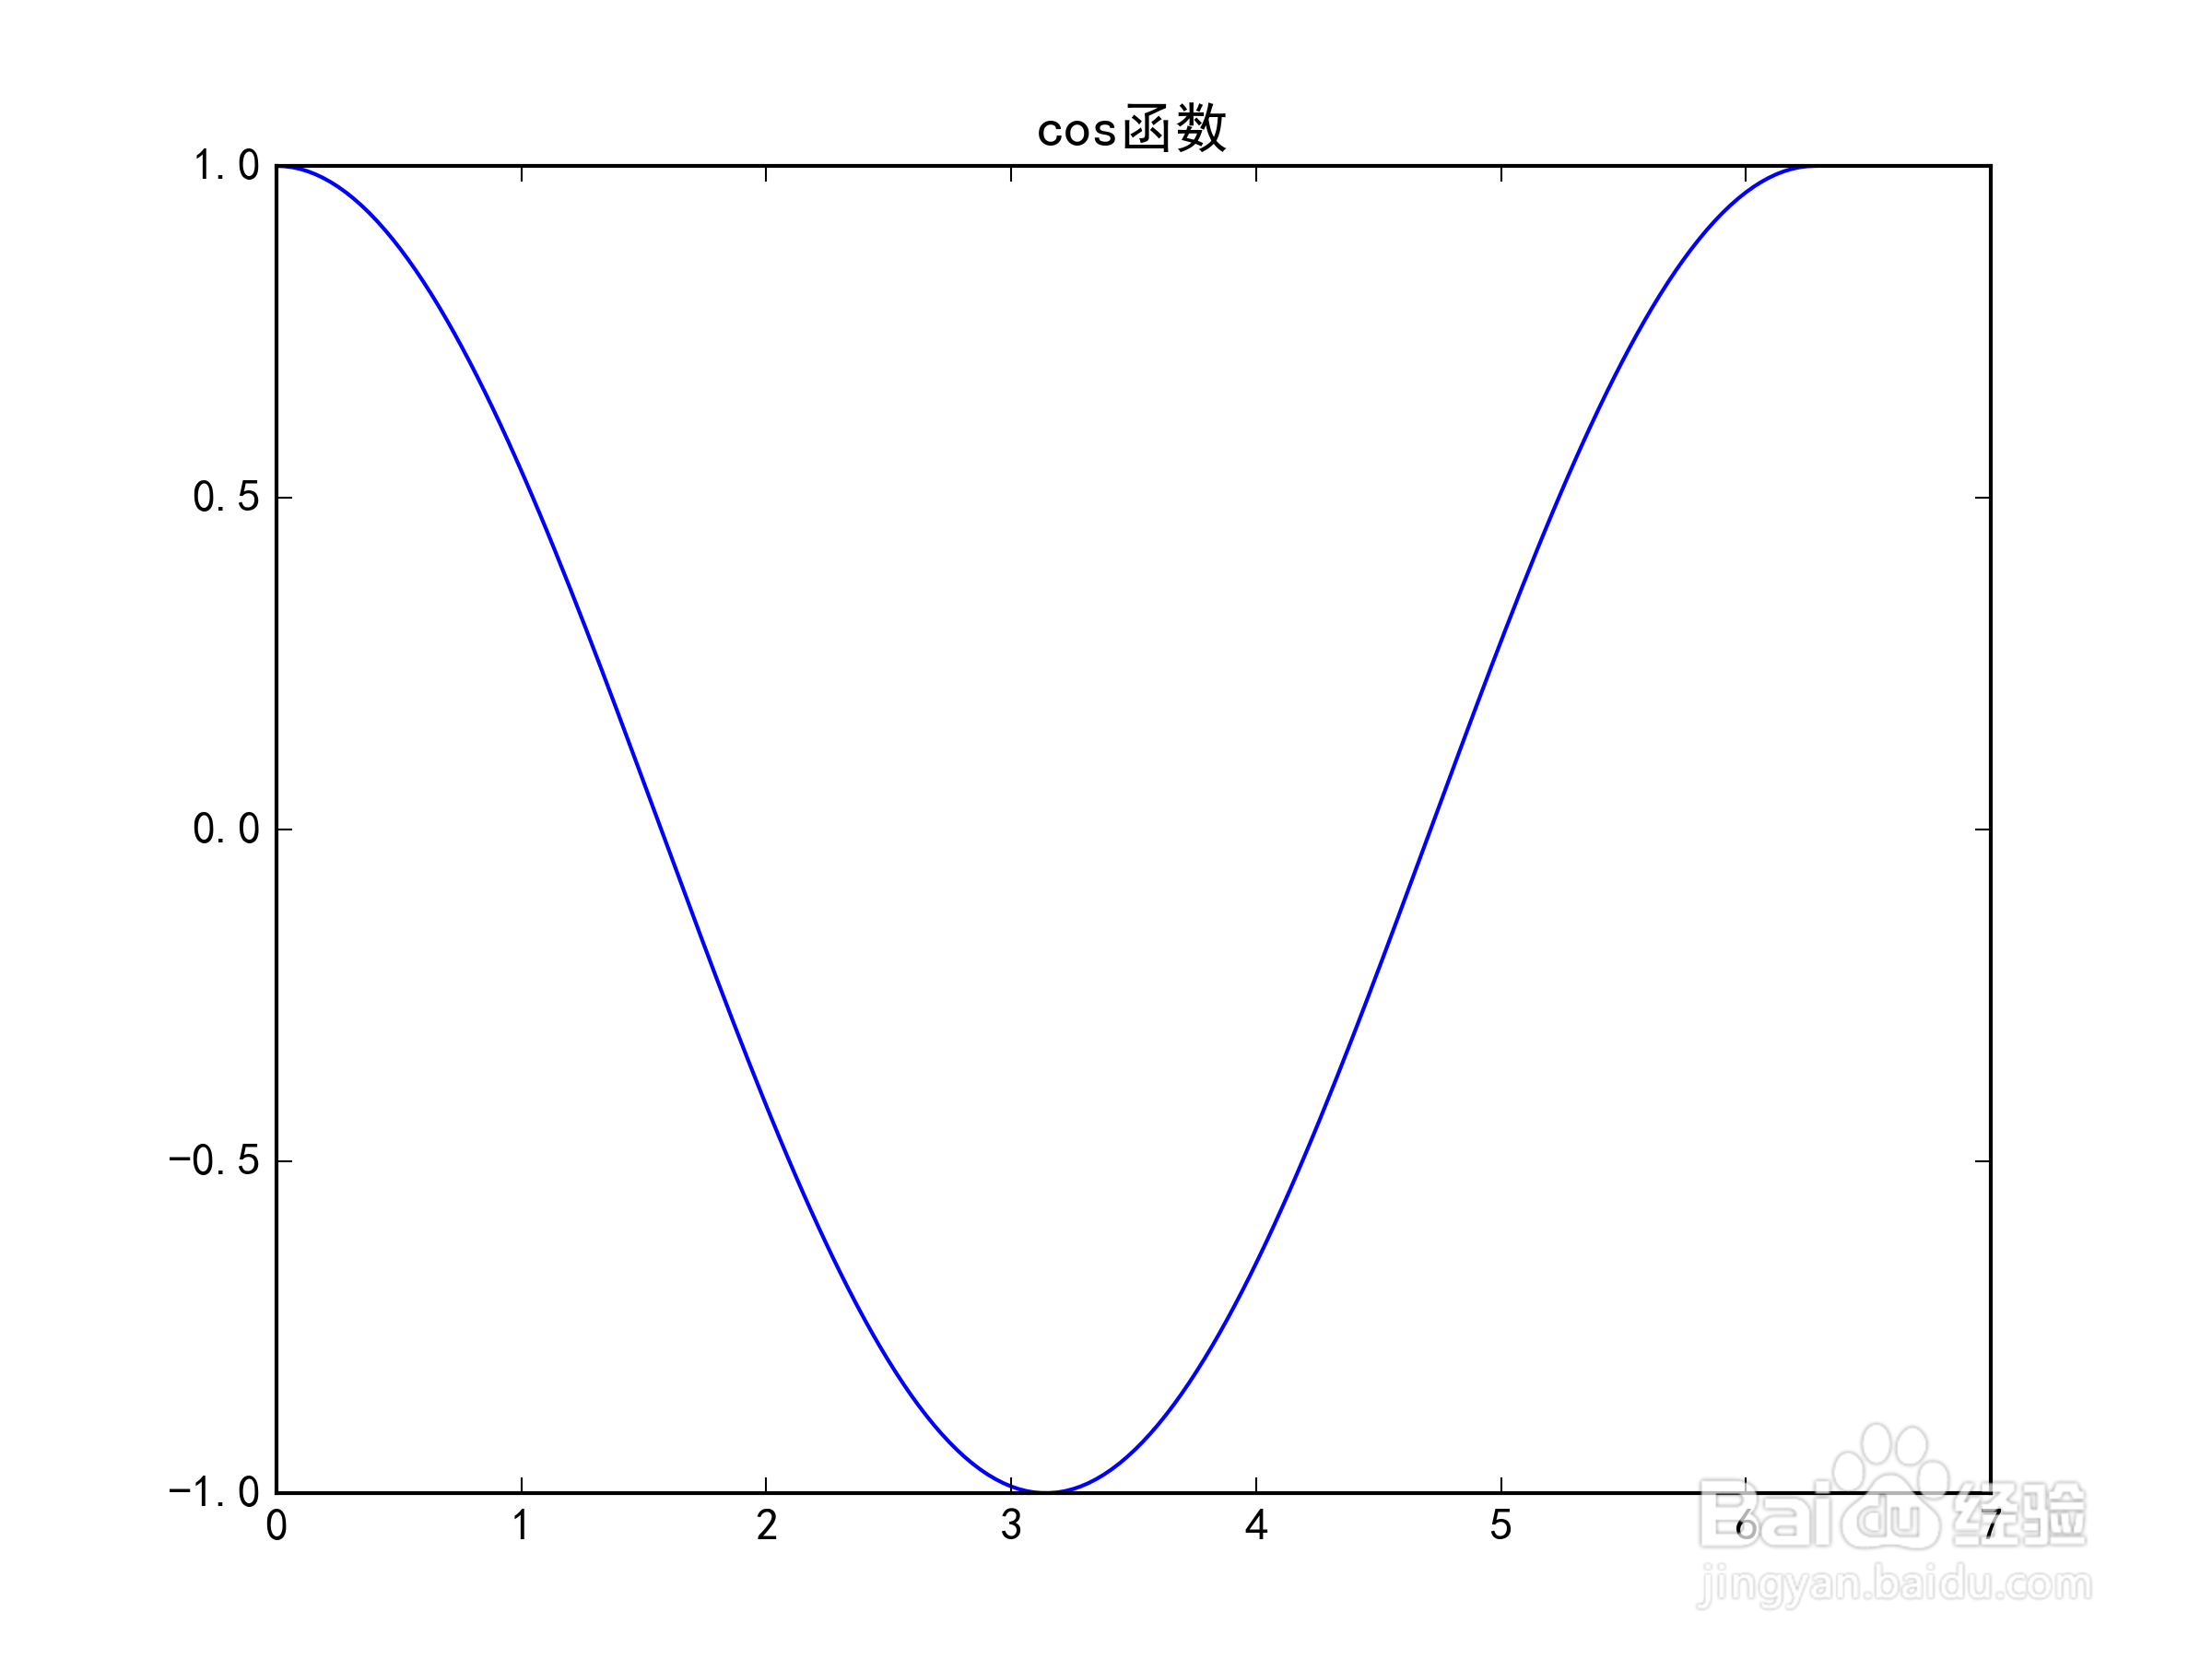
x = np.linspace(0,2*np.pi,200)
y = np.cos(x)
plt.plot(x,y)
plt.title('cos函数')
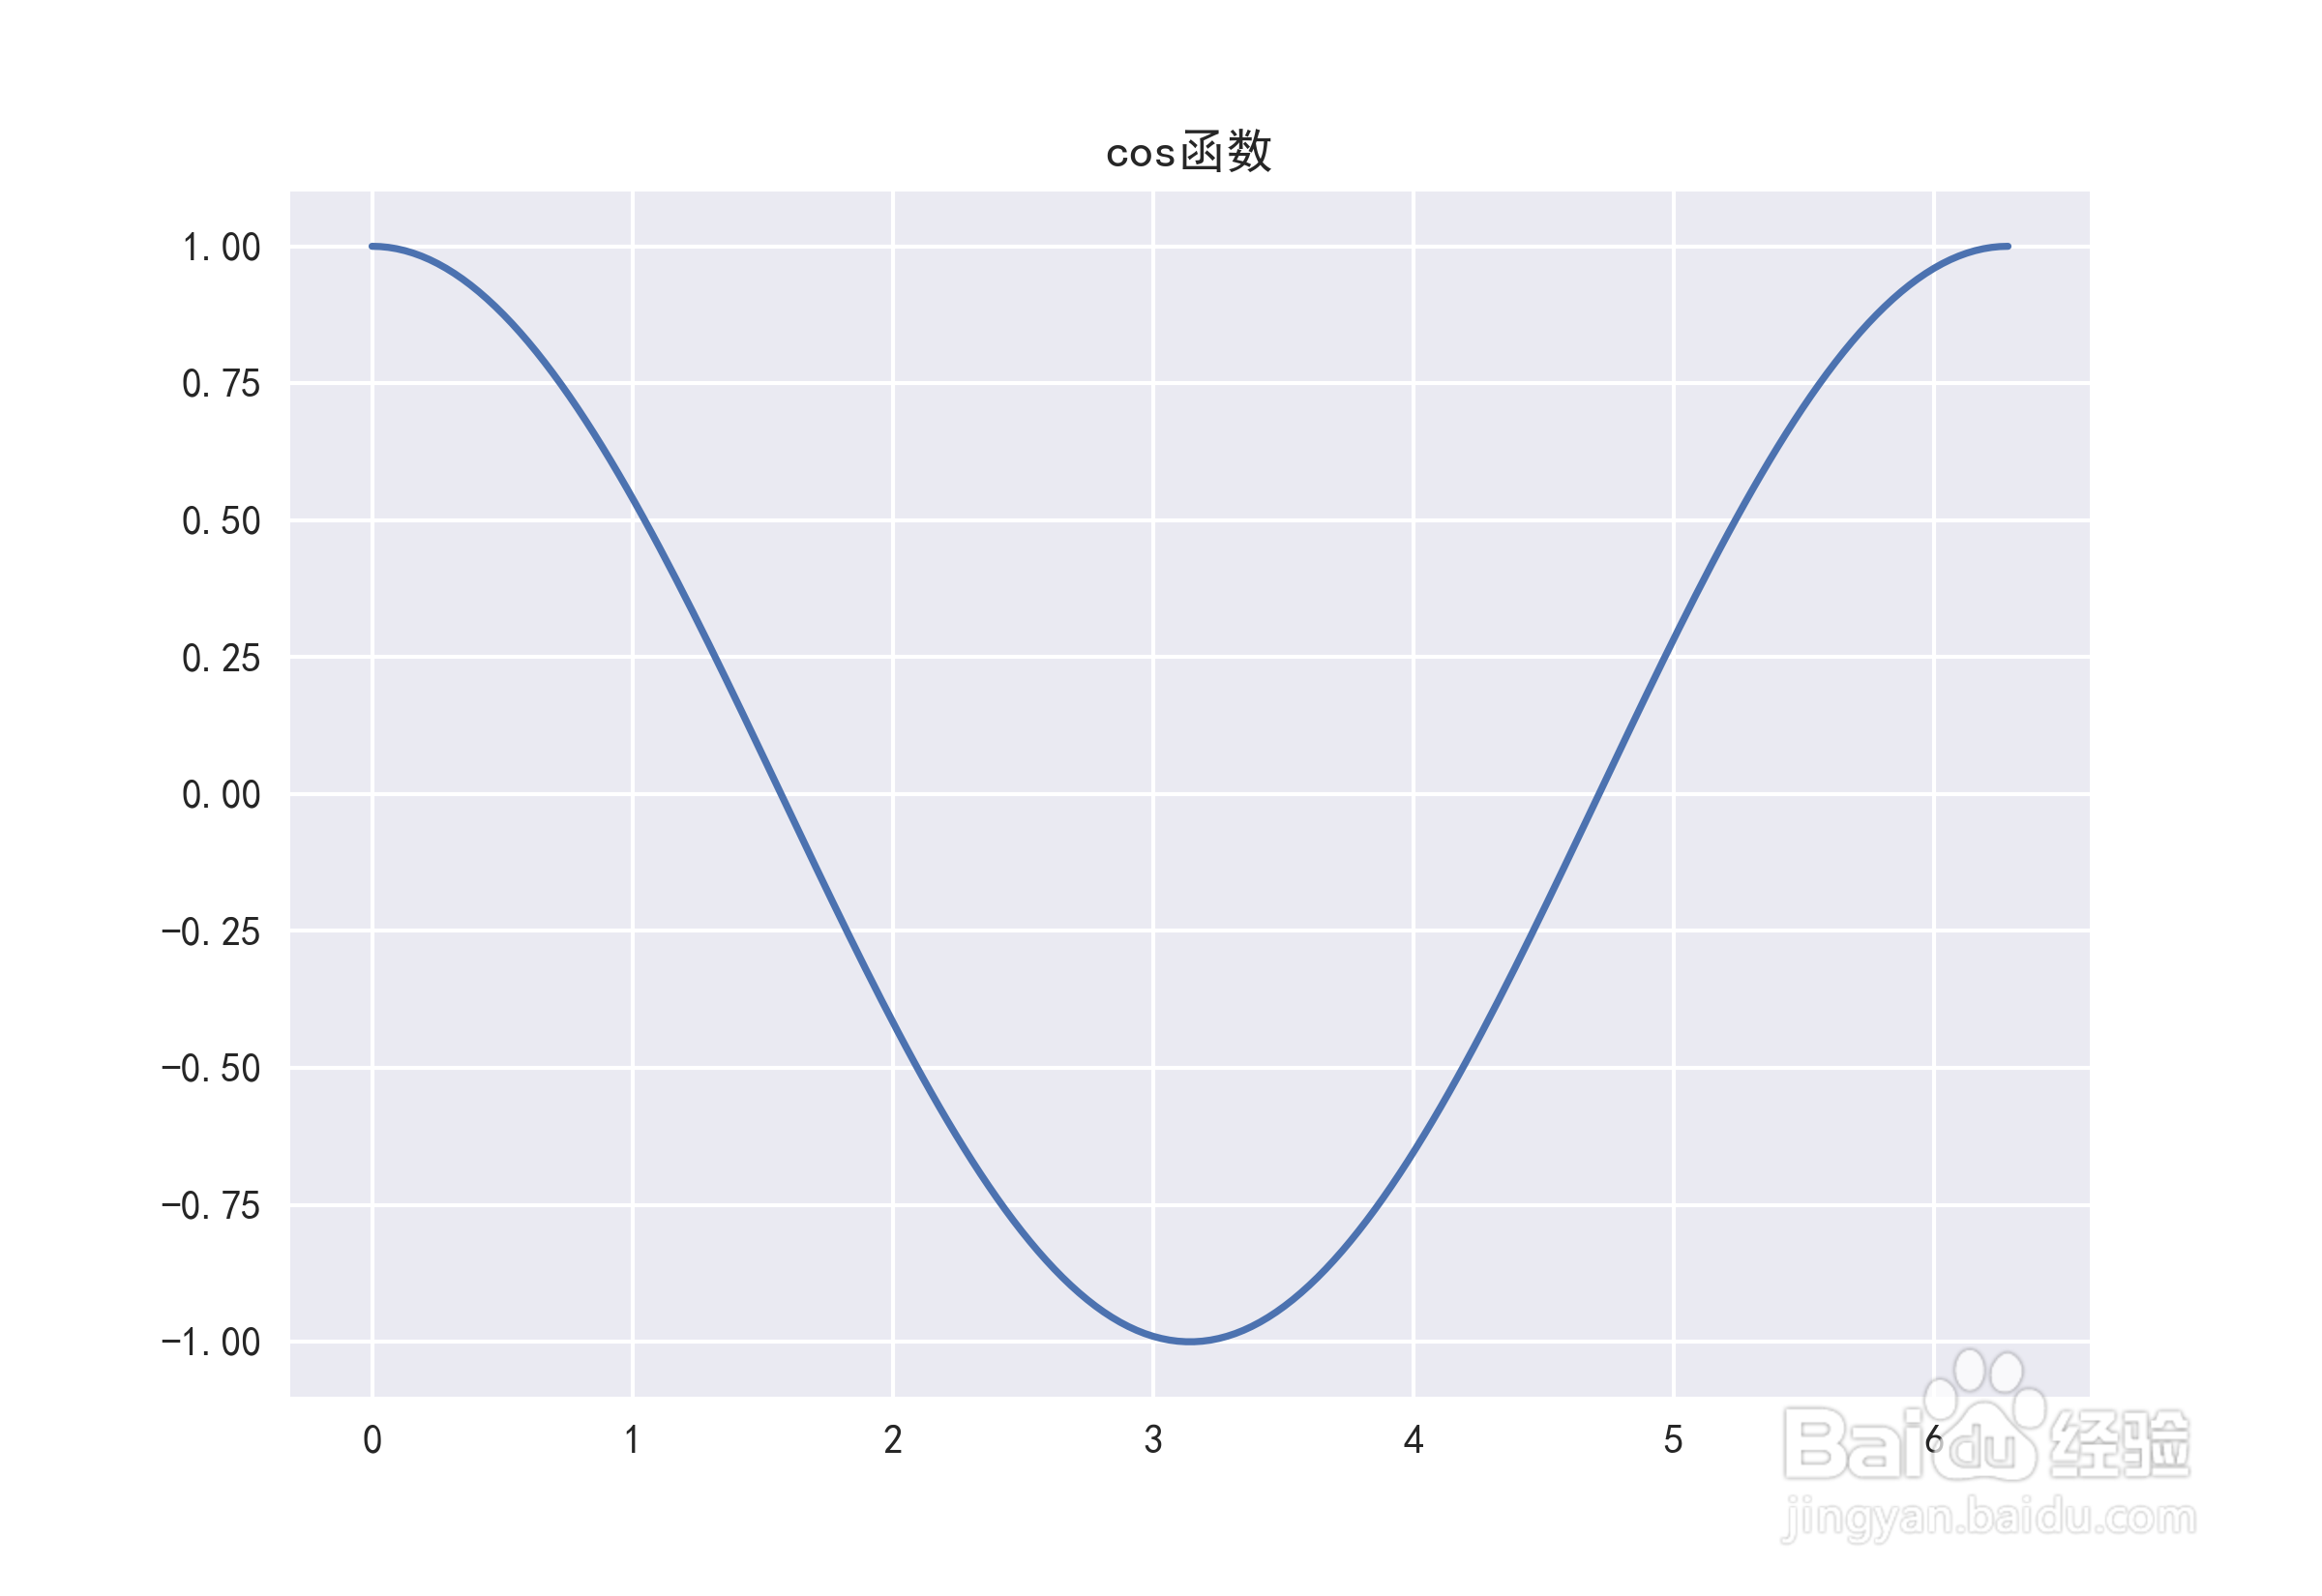
3、再尝试seaborn风格:plt.style.use('seaborn')
4、下面是bmh风格:plt.style.use('bmh')
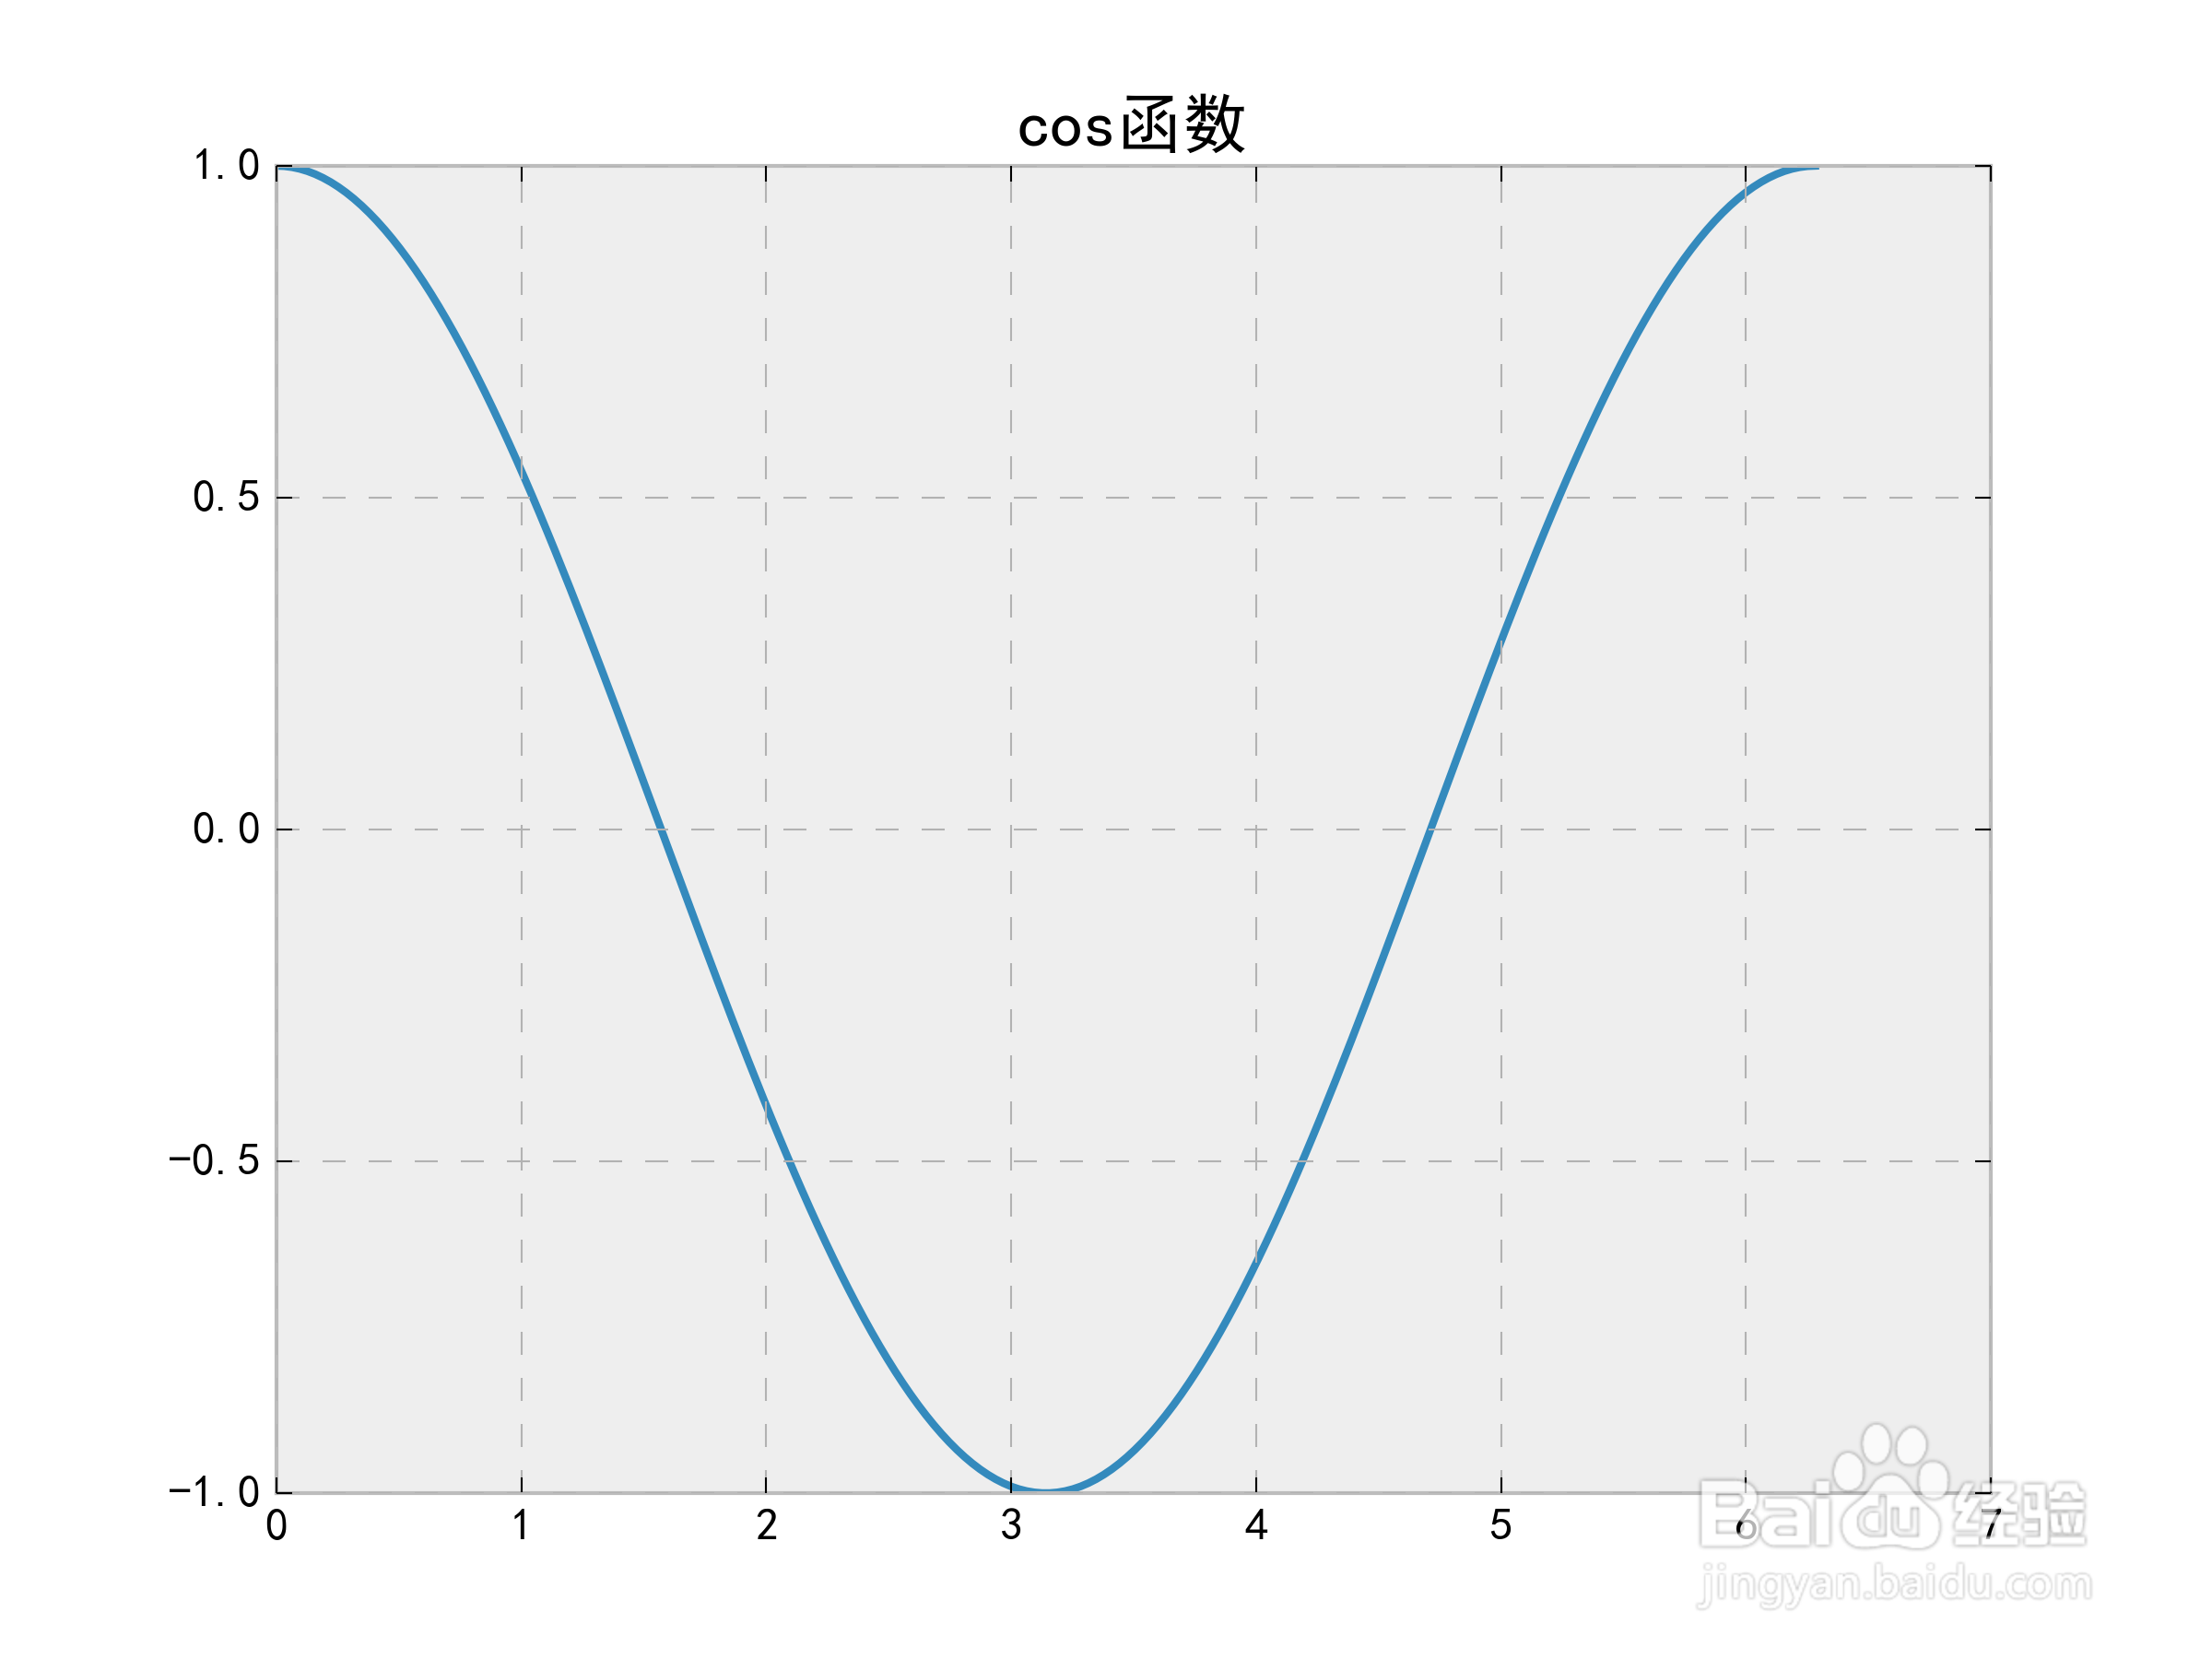
5、下面是classic风格:plt.style.use('classic')
声明:本网站引用、摘录或转载内容仅供网站访问者交流或参考,不代表本站立场,如存在版权或非法内容,请联系站长删除,联系邮箱:site.kefu@qq.com。
阅读量:129
阅读量:85
阅读量:110
阅读量:193
阅读量:174