【Mathematica】怎么产生Graphics图?
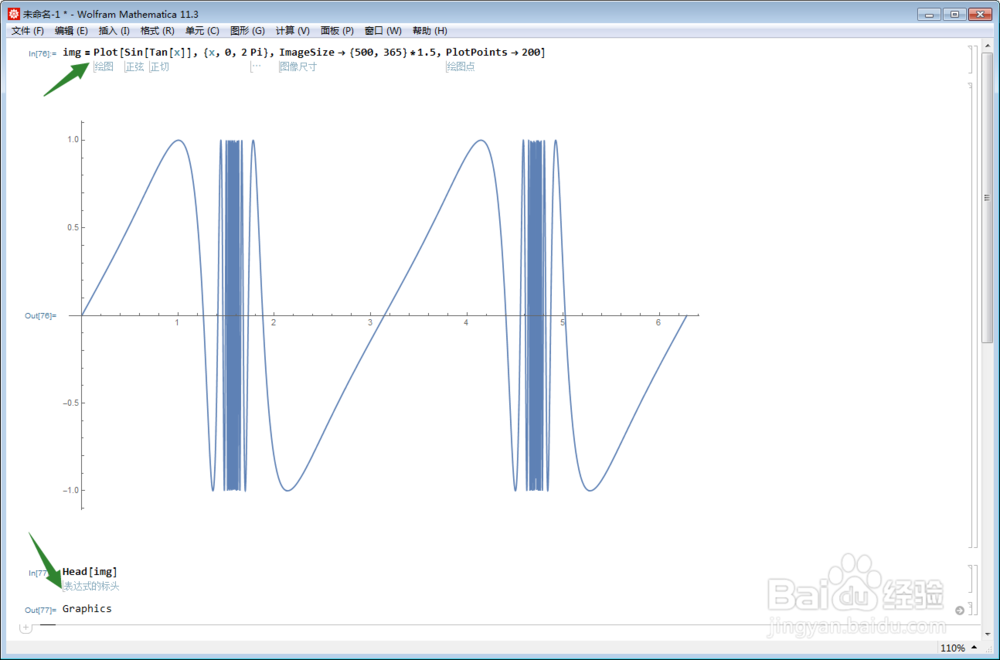
1、首先,Mathematica中各种以Plot结尾的命令,都可以得到Graphics:
2、以Plot结尾的命令包括但不限于:
Names["*Plot"]

3、直接Graphics命令,也可以得到Graphics:
Graphics[{Hue[0.5], Disk[]}]

4、如果一个图片img是Image:

5、则可以通过Show,把img转化为Graphics:

6、实际上,Show可以把若干Graphics叠合到一起:
Show[Plot[Sin[Tan[x]], {x, 0, 2 Pi}, ImageSize -> {500, 365}*1.5,
PlotPoints -> 200],
Graphics[{Hue[0.5], Disk[]}], PlotRange -> All,
AspectRatio -> Automatic]

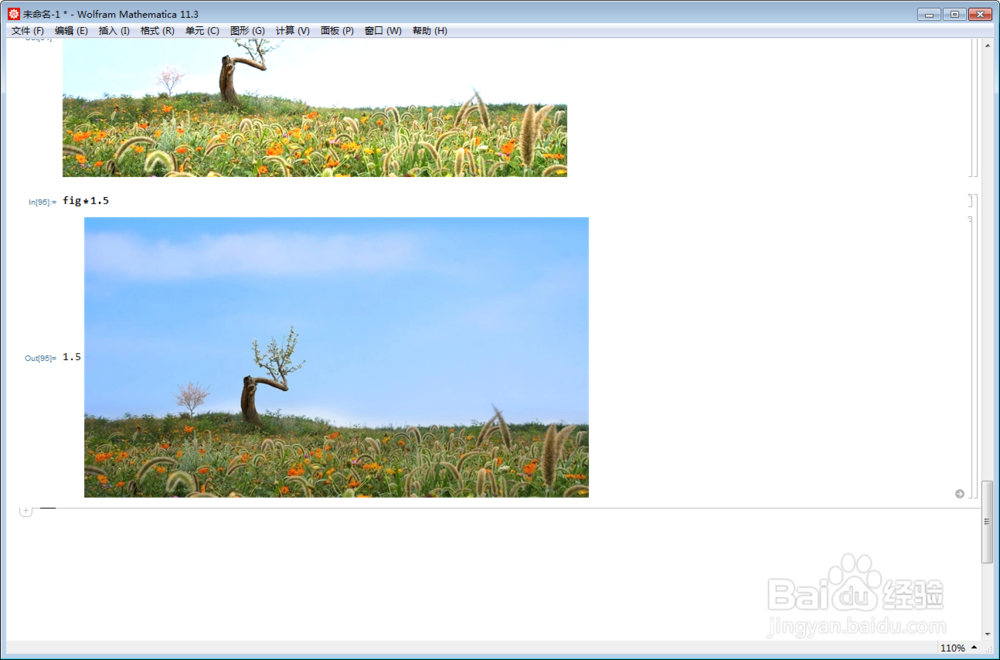
7、Image格式的img,可以执行倍数运算:
img*1.5

8、而Graphics格式的fig的倍数运算无意义:
fig*1.5
声明:本网站引用、摘录或转载内容仅供网站访问者交流或参考,不代表本站立场,如存在版权或非法内容,请联系站长删除,联系邮箱:site.kefu@qq.com。
阅读量:181
阅读量:76
阅读量:45
阅读量:130
阅读量:60