jQuery EasyUI从入门到精通(16)DataGrid(6)
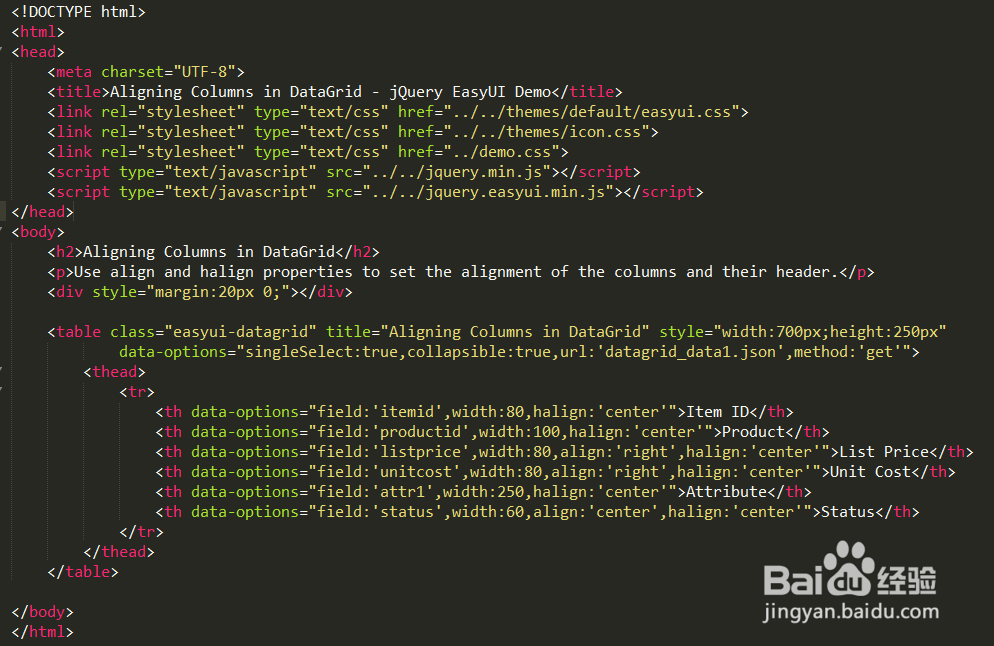
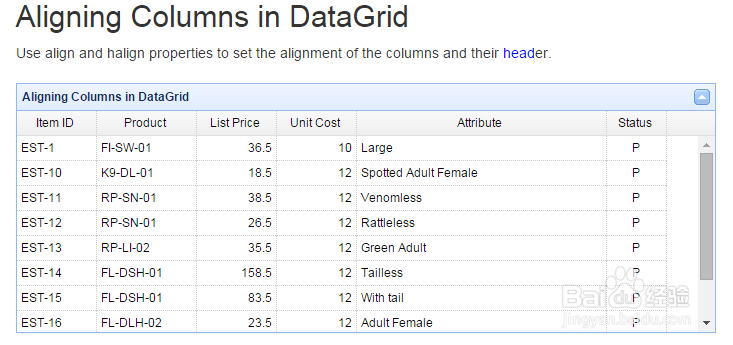
1、Aligning Columns in DataGrid(数据表格DataGrid的列对齐),Use align and halign properties to set the alignment of the columns and their header.
<!DOCTYPE html>
<html>
<head>
<meta charset="UTF-8">
<title>Aligning Columns in DataGrid - jQuery EasyUI Demo</title>
<link rel="stylesheet" type="text/css" href="../../themes/default/easyui.css">
<link rel="stylesheet" type="text/css" href="../../themes/icon.css">
<link rel="stylesheet" type="text/css" href="../demo.css">
<script type="text/javascript" src="../../jquery.min.js"></script>
<script type="text/javascript" src="../../jquery.easyui.min.js"></script>
</head>
<body>
<h2>Aligning Columns in DataGrid</h2>
Use align and halign properties to set the alignment of the columns and their header.
<div style="margin:20px 0;">帽八</div>
<table class="easyui-datagrid" title="Aligning Columns in DataGrid" style="width:700px;height:250px"
data-options="singleSelect:true,collapsible:true,url:'datagrid_data1.json',method:'get'">
<thead>
<tr>
<th data-options="field:'itemid',width:80,halign:'center'">Item ID</th>
<th data-options="侨侧field:'productid',width:100,halign:'center'">Product</th>
<th data-options="field:'listprice',width:80,align:'right',halign:'center'">List Price</th>
<th data-options="field:'unitcost',width:80,align:'right',halign:'center'">Unit Cost</th>
<th data-options="field:'attr1',width:250,halign:'center'">Attribute</th>
<th data-options="field:'status',width:60,align:'center',halign:'center'">Status</th>诸菊珠
</tr>
</thead>
</table>
</body>
</html>
2、Aligning Columns in DataGrid(数据表格DataGrid的列对齐),运行效果如下图所示。
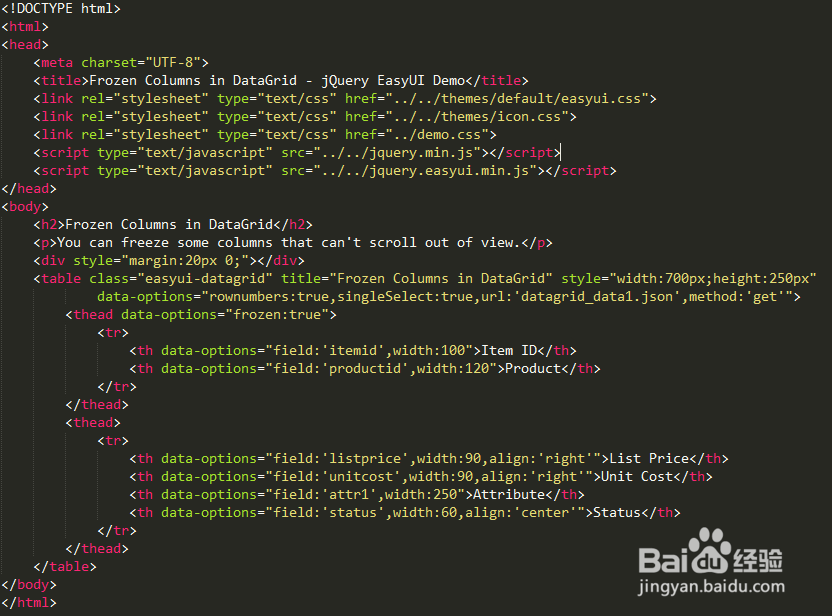
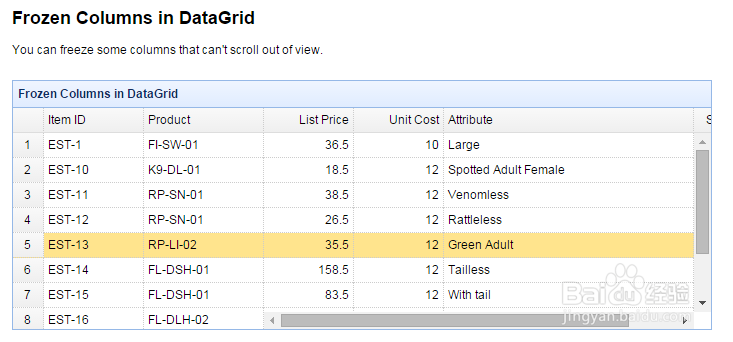
3、Frozen Columns in DataGrid(在数据表格中冻结的列),You can freeze some columns that can't scroll out of view(你可以冻结一些列让其不能滚动出视图).
<!DOCTYPE html>
<html>
<head>
<meta charset="UTF-8">
<title>Frozen Columns in DataGrid - jQuery EasyUI Demo</title>
<link rel="stylesheet" type="text/css" href="../../themes/default/easyui.css">
<link rel="stylesheet" type="text/css" href="../../themes/icon.css">
<link rel="stylesheet" type="text/css" href="../demo.css">
<script type="text/javascript" src="../../jquery.min.js"></script>
<script type="text/javascript" src="../../jquery.easyui.min.js"></script>
</head>
<body>
<h2>Frozen Columns in DataGrid</h2>
You can freeze some columns that can't scroll out of view.
<div style="margin:20px 0;"></div>
<table class="easyui-datagrid" title="Frozen Columns in DataGrid" style="width:700px;height:250px"
data-options="rownumbers:true,singleSelect:true,url:'datagrid_data1.json',method:'get'">
<thead data-options="frozen:true">
<tr>
<th data-options="field:'itemid',width:100">Item ID</th>
<th data-options="field:'productid',width:120">Product</th>
</tr>
</thead>
<thead>
<tr>
<th data-options="field:'listprice',width:90,align:'right'">List Price</th>
<th data-options="field:'unitcost',width:90,align:'right'">Unit Cost</th>
<th data-options="field:'attr1',width:250">Attribute</th>
<th data-options="field:'status',width:60,align:'center'">Status</th>
</tr>
</thead>
</table>
</body>
</html>
4、Frozen Columns in DataGrid(在数据表格中冻结的列),运行效果如下图所示。
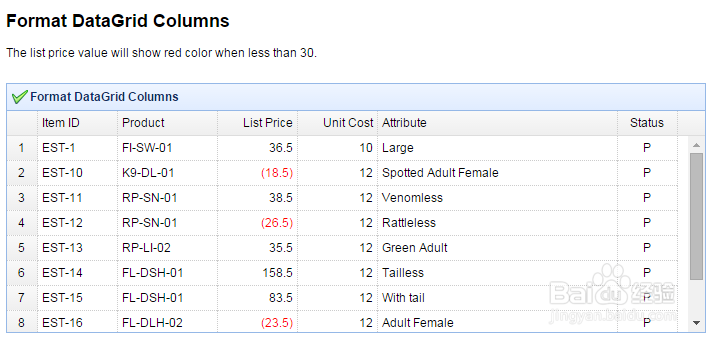
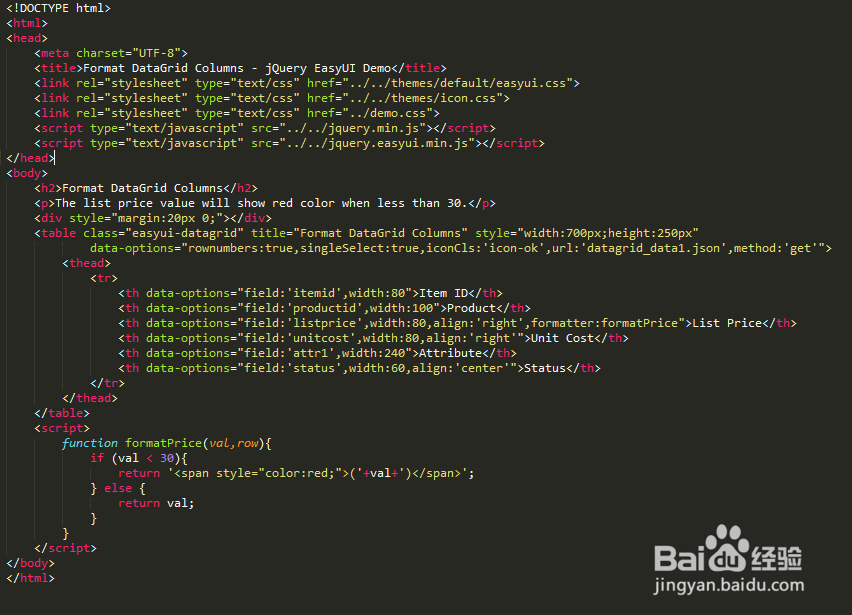
5、Format DataGrid Columns(数据表格的列格式),The list price value will show red color when less than 30(当列表价格的值小于30的时候将会显示成红色).
<!DOCTYPE html>
<html>
<head>
<meta charset="UTF-8">
<title>Format DataGrid Columns - jQuery EasyUI Demo</title>
<link rel="stylesheet" type="text/css" href="../../themes/default/easyui.css">
<link rel="stylesheet" type="text/css" href="../../themes/icon.css">
<link rel="stylesheet" type="text/css" href="../demo.css">
<script type="text/javascript" src="../../jquery.min.js"></script>
<script type="text/javascript" src="../../jquery.easyui.min.js"></script>
</head>
<body>
<h2>Format DataGrid Columns</h2>
The list price value will show red color when less than 30.
<div style="margin:20px 0;"></div>
<table class="easyui-datagrid" title="Format DataGrid Columns" style="width:700px;height:250px"
data-options="rownumbers:true,singleSelect:true,iconCls:'icon-ok',url:'datagrid_data1.json',method:'get'">
<thead>
<tr>
<th data-options="field:'itemid',width:80">Item ID</th>
<th data-options="field:'productid',width:100">Product</th>
<th data-options="field:'listprice',width:80,align:'right',formatter:formatPrice">List Price</th>
<th data-options="field:'unitcost',width:80,align:'right'">Unit Cost</th>
<th data-options="field:'attr1',width:240">Attribute</th>
<th data-options="field:'status',width:60,align:'center'">Status</th>
</tr>
</thead>
</table>
<script>
function formatPrice(val,row){
if (val < 30){
return '<span style="color:red;">('+val+')</span>';
} else {
return val;
}
}
</script>
</body>
</html>
6、Format DataGrid Columns(数据表格的列格式),运行效果如下图所示。