jQuery EasyUI从入门到精通(17)DataGrid(7)
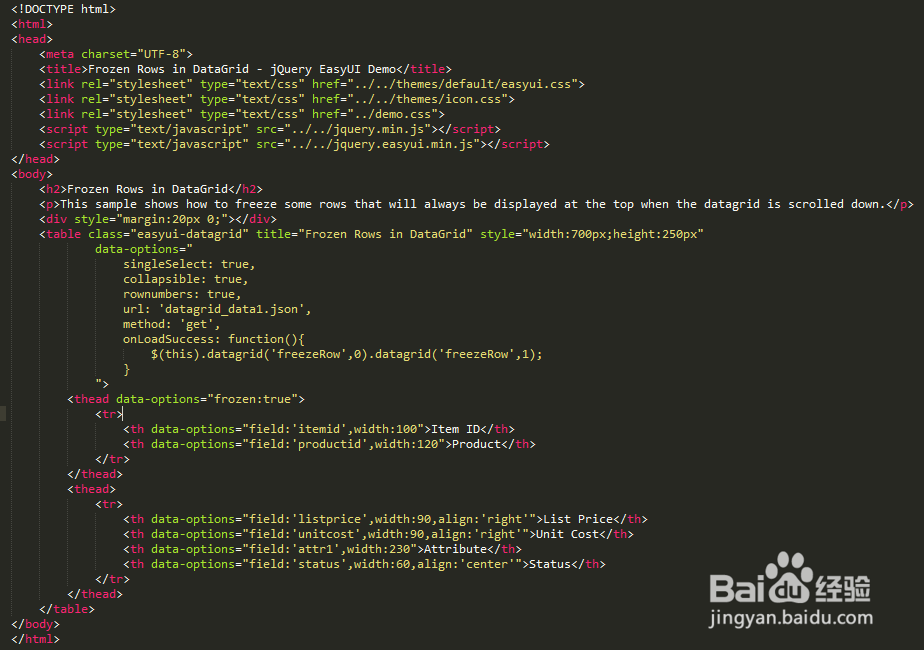
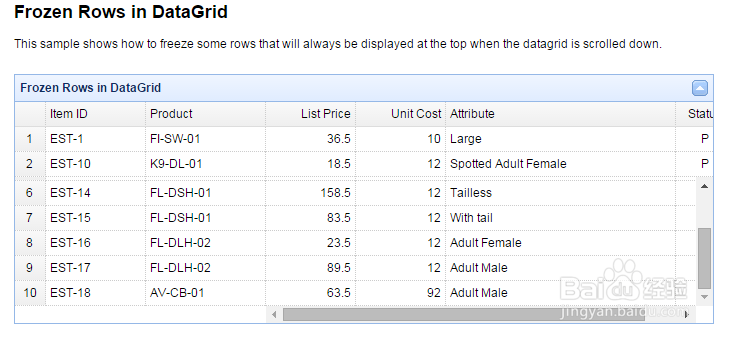
1、Frozen Rows in DataGrid(在数据表格中冻结的行),This sample shows how to freeze some rows that will always be displayed at the top when the datagrid is scrolled down.
<!DOCTYPE html>
<html>
<head>
<meta charset="UTF-8">
<title>Frozen Rows in DataGrid - jQuery EasyUI Demo</title>
<link rel="stylesheet" type="text/css" href="../../themes/default/easyui.css">
<link rel="stylesheet" type="text/css" href="../../themes/icon.css">
<link rel="stylesheet" type="text/css" href="../demo.css">
<script type="text/javascript" src="../../jquery.min.js"></script>
<script type="text/javascript" src="../../jquery.easyui.min.js"></script>
</head>
<body>
<h2>Frozen Rows in DataGrid</h2>
This sample shows how to freeze some rows that will always be displayed at the top when the datagrid is scrolled down.
<div style="margin:20px 0;"></div>
<table class="easyui-datagrid" title="Frozen Rows in DataGrid" style="width:700px;height:250px"
data-options="
singleSelect: true,
collapsible: true,
rownumbers: true,
url: 'datagrid_data1.json',
method: 'get',
onLoadSuccess: function(){
$(this).datagrid('freezeRow',0).datagrid('freezeRow',1);
}
">
<thead data-options="frozen:true">
<tr>
<th data-options="field:'itemid',width:100">Item ID</th>
<th data-options="field:'productid',width:120">Product</th>
</tr>
</thead>
<thead>
<tr>
<th data-options="field:'listprice',width:90,align:'right'">List Price</th>
<th data-options="field:'unitcost',width:90,align:'right'">Unit Cost</th>
<th data-options="field:'attr1',width:230">Attribute</th>
<th data-options="field:'status',width:60,align:'center'">Status</th>
</tr>
</thead>
</table>
</body>
</html>
2、Frozen Rows in DataGrid(在数据表格中冻结的行),运行效果如下图所示。
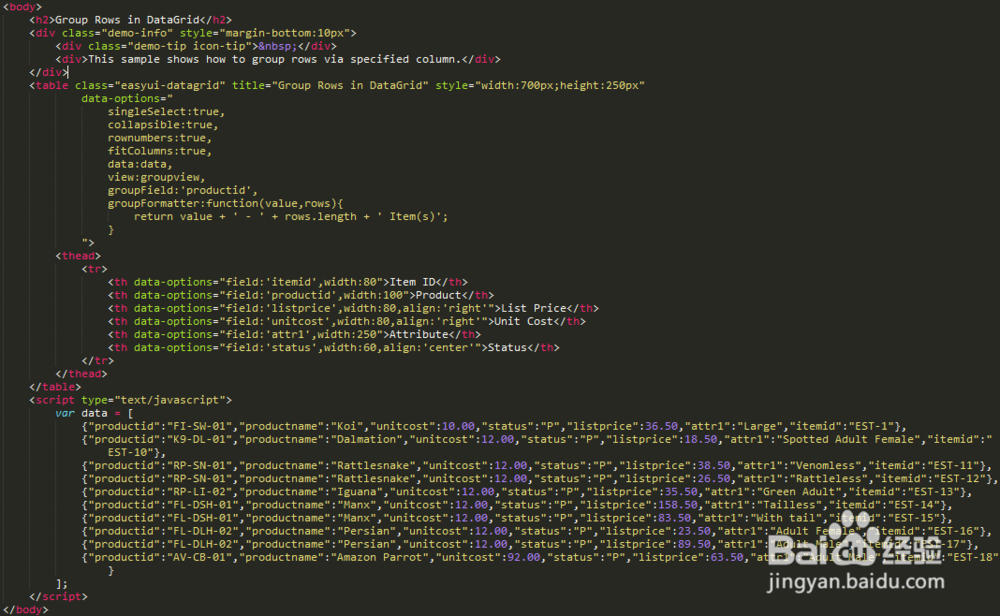
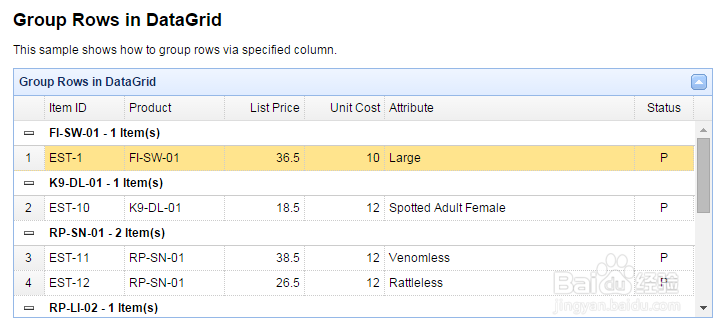
3、Group Rows in DataGrid(数据表格行分组),This sample shows how to group rows via specified column.
<html>
<head>
<meta http-equiv="Content-Type" content="text/html; charset=UTF-8">
<meta name="keywords" content="jquery,ui,easy,easyui,web">
<meta name="description" content="easyui help you build your web page easily!">
<title>Group Rows in DataGrid - jQuery EasyUI Demo</title>
<link rel="stylesheet" type="text/css" href="http://www.jeasyui.com/easyui/themes/default/easyui.css">
<link rel="stylesheet" type="text/css" href="http://www.jeasyui.com/easyui/themes/icon.css">
<link rel="stylesheet" type="text/css" href="http://www.jeasyui.com/easyui/demo/demo.css">
<script type="text/javascript" src="http://code.jquery.com/jquery-1.4.4.min.js"></script>
<script type="text/javascript" src="http://www.jeasyui.com/easyui/jquery.easyui.min.js"></script>
<script type="text/javascript" src="http://www.jeasyui.com/easyui/datagrid-groupview.js"></script>
</head>
<body>
<h2>Group Rows in DataGrid</h2>
<div class="demo-info" style="margin-bottom:10px">
<div class="demo-tip icon-tip"> </div>
<div>This sample shows how to group rows via specified column.</div>
</div>
<table class="easyui-datagrid" title="Group Rows in DataGrid" style="width:700px;height:250px"
data-options="
singleSelect:true,
collapsible:true,
rownumbers:true,
fitColumns:true,
data:data,
view:groupview,
groupField:'productid',
groupFormatter:function(value,rows){
return value + ' - ' + rows.length + ' Item(s)';
}
">
<thead>
<tr>
<th data-options="field:'itemid',width:80">Item ID</th>
<th data-options="field:'productid',width:100">Product</th>
<th data-options="field:'listprice',width:80,align:'right'">List Price</th>
<th data-options="field:'unitcost',width:80,align:'right'">Unit Cost</th>
<th data-options="field:'attr1',width:250">Attribute</th>
<th data-options="field:'status',width:60,align:'center'">Status</th>
</tr>
</thead>
</table>
<script type="text/javascript">
var data = [
{"productid":"FI-SW-01","productname":"Koi","unitcost":10.00,"status":"P","listprice":36.50,"attr1":"Large","itemid":"EST-1"},
{"productid":"K9-DL-01","productname":"Dalmation","unitcost":12.00,"status":"P","listprice":18.50,"attr1":"Spotted Adult Female","itemid":"EST-10"},
{"productid":"RP-SN-01","productname":"Rattlesnake","unitcost":12.00,"status":"P","listprice":38.50,"attr1":"Venomless","itemid":"EST-11"},
{"productid":"RP-SN-01","productname":"Rattlesnake","unitcost":12.00,"status":"P","listprice":26.50,"attr1":"Rattleless","itemid":"EST-12"},
{"productid":"RP-LI-02","productname":"Iguana","unitcost":12.00,"status":"P","listprice":35.50,"attr1":"Green Adult","itemid":"EST-13"},
{"productid":"FL-DSH-01","productname":"Manx","unitcost":12.00,"status":"P","listprice":158.50,"attr1":"Tailless","itemid":"EST-14"},
{"productid":"FL-DSH-01","productname":"Manx","unitcost":12.00,"status":"P","listprice":83.50,"attr1":"With tail","itemid":"EST-15"},
{"productid":"FL-DLH-02","productname":"Persian","unitcost":12.00,"status":"P","listprice":23.50,"attr1":"Adult Female","itemid":"EST-16"},
{"productid":"FL-DLH-02","productname":"Persian","unitcost":12.00,"status":"P","listprice":89.50,"attr1":"Adult Male","itemid":"EST-17"},
{"productid":"AV-CB-01","productname":"Amazon Parrot","unitcost":92.00,"status":"P","listprice":63.50,"attr1":"Adult Male","itemid":"EST-18"}
];
</script>
</body>
</html>
4、Group Rows in DataGrid(数据表格行分组),运行效果如下图所示。
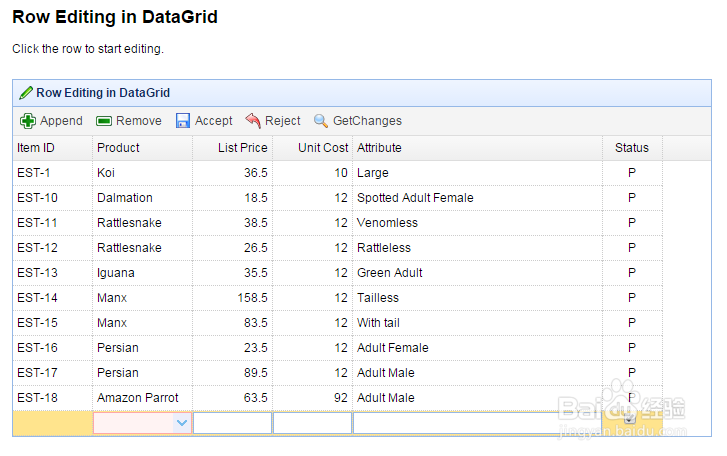
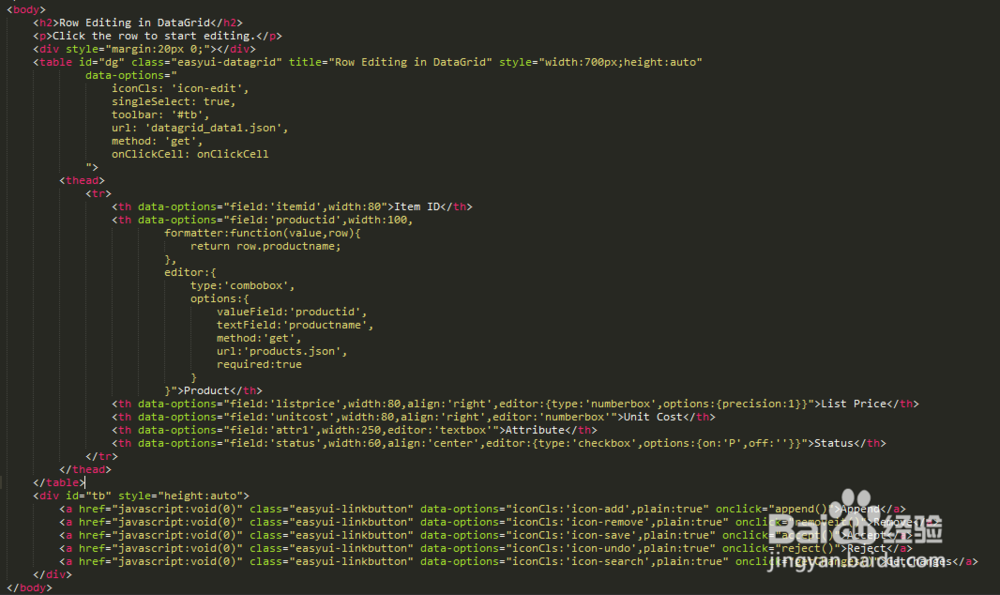
5、Row Editing in DataGrid(数据表格的行编辑),Click the row to start editing.
HTML基本结构如下:
<!DOCTYPE html>
<html>
<head>
<meta charset="UTF-8">
<title>Row Editing in DataGrid - jQuery EasyUI Demo</title>
<link rel="stylesheet" type="text/css" href="../../themes/default/easyui.css">
<link rel="stylesheet" type="text/css" href="../../themes/icon.css">
<link rel="stylesheet" type="text/css" href="../demo.css">
<script type="text/javascript" src="../../jquery.min.js"></script>
<script type="text/javascript" src="../../jquery.easyui.min.js"></script>
</head>
<body>
<h2>Row Editing in DataGrid</h2>
Click the row to start editing.
<div style="margin:20px 0;"></div>
<table id="dg" class="easyui-datagrid" title="Row Editing in DataGrid" style="width:700px;height:auto"
data-options="
iconCls: 'icon-edit',
singleSelect: true,
toolbar: '#tb',
url: 'datagrid_data1.json',
method: 'get',
onClickCell: onClickCell
">
<thead>
<tr>
<th data-options="field:'itemid',width:80">Item ID</th>
<th data-options="field:'productid',width:100,
formatter:function(value,row){
return row.productname;
},
editor:{
type:'combobox',
options:{
valueField:'productid',
textField:'productname',
method:'get',
url:'products.json',
required:true
}
}">Product</th>
<th data-options="field:'listprice',width:80,align:'right',editor:{type:'numberbox',options:{precision:1}}">List Price</th>
<th data-options="field:'unitcost',width:80,align:'right',editor:'numberbox'">Unit Cost</th>
<th data-options="field:'attr1',width:250,editor:'textbox'">Attribute</th>
<th data-options="field:'status',width:60,align:'center',editor:{type:'checkbox',options:{on:'P',off:''}}">Status</th>
</tr>
</thead>
</table>
<div id="tb" style="height:auto">
<a href="javascript:void(0)" class="easyui-linkbutton" data-options="iconCls:'icon-add',plain:true" onclick="append()">Append</a>
<a href="javascript:void(0)" class="easyui-linkbutton" data-options="iconCls:'icon-remove',plain:true" onclick="removeit()">Remove</a>
<a href="javascript:void(0)" class="easyui-linkbutton" data-options="iconCls:'icon-save',plain:true" onclick="accept()">Accept</a>
<a href="javascript:void(0)" class="easyui-linkbutton" data-options="iconCls:'icon-undo',plain:true" onclick="reject()">Reject</a>
<a href="javascript:void(0)" class="easyui-linkbutton" data-options="iconCls:'icon-search',plain:true" onclick="getChanges()">GetChanges</a>
</div>
</body>
</html>
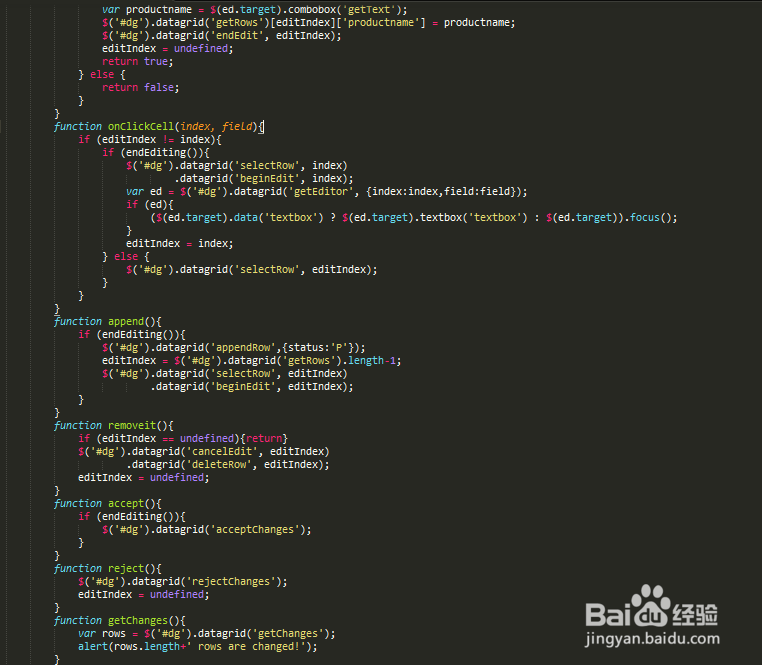
6、Row Editing in DataGrid(数据表格的行编辑)案例,Javascript代码如下:
<script type="text/javascript">
var editIndex = undefined;
function endEditing(){
if (editIndex == undefined){return true}
if ($('#dg').datagrid('validateRow', editIndex)){
var ed = $('#dg').datagrid('getEditor', {index:editIndex,field:'productid'});
var productname = $(ed.target).combobox('getText');
$('#dg').datagrid('getRows')[editIndex]['productname'] = productname;
$('#dg').datagrid('endEdit', editIndex);
editIndex = undefined;
return true;
} else {
return false;
}
}
function onClickCell(index, field){
if (editIndex != index){
if (endEditing()){
$('#dg').datagrid('selectRow', index)
.datagrid('beginEdit', index);
var ed = $('#dg').datagrid('getEditor', {index:index,field:field});
if (ed){
($(ed.target).data('textbox') ? $(ed.target).textbox('textbox') : $(ed.target)).focus();
}
editIndex = index;
} else {
$('#dg').datagrid('selectRow', editIndex);
}
}
}
function append(){
if (endEditing()){
$('#dg').datagrid('appendRow',{status:'P'});
editIndex = $('#dg').datagrid('getRows').length-1;
$('#dg').datagrid('selectRow', editIndex)
.datagrid('beginEdit', editIndex);
}
}
function removeit(){
if (editIndex == undefined){return}
$('#dg').datagrid('cancelEdit', editIndex)
.datagrid('deleteRow', editIndex);
editIndex = undefined;
}
function accept(){
if (endEditing()){
$('#dg').datagrid('acceptChanges');
}
}
function reject(){
$('#dg').datagrid('rejectChanges');
editIndex = undefined;
}
function getChanges(){
var rows = $('#dg').datagrid('getChanges');
alert(rows.length+' rows are changed!');
}
</script>
7、Row Editing in DataGrid(数据表格的行编辑),运行效果图如下。